SYSTEM METER
Overview
The system meter is a virtual multimeter provided as a standard instrument during interactive simulation. It offers real-time voltage and current measurement using live probes that can be placed on any net in the schematic while the simulation is running.
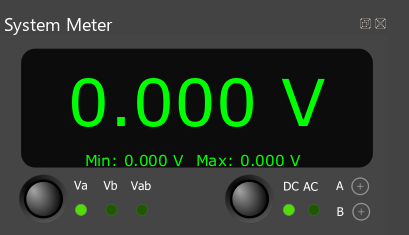
The system meter panel showing the readout display, measurement parameter and coupling controls, and the two probe buttons (A and B).
In voltage mode, the meter measures the potential at a probed point with respect to ground. Two independent probes (A and B) are available, and a differential mode (Va-Vb) allows measurement of the voltage between any two points in the circuit. Both analogue and digital nets can be probed; for digital nets the voltage reading is derived from the logic state and the power rail voltages of that net.
Current measurement is available when wire currents are enabled via System > Set Animation Options. When this option is active, the simulator inserts virtual ammeters into the netlist and animated arrows appear on the schematic wires to show the direction of current flow. The meter can then read the current at any probed analogue net. Current readings are always shown as absolute values; use the wire arrows to determine the direction of flow. Current measurement is primarily an educational tool for visualising current flow in a circuit and is not available on digital nets.
Modes of Operation
The meter has two controls: a button that cycles through the available measurement modes, and a coupling button that toggles between DC and AC.
|
Parameter |
Description |
|
Va |
Voltage at probe A with respect to ground. |
|
Vb |
Voltage at probe B with respect to ground. |
|
Va-Vb |
Differential voltage between probe A and probe B. |
|
Ia |
Current at probe A. Requires wire currents to be enabled. |
|
Ib |
Current at probe B. Requires wire currents to be enabled. |
|
Coupling |
Description |
|
DC |
Direct coupling. Displays the instantaneous value. Voltage readings are signed; current readings are always positive. |
|
AC |
AC coupling. Removes the DC component and displays an RMS-equivalent reading. The reading is calibrated for sinusoidal waveforms; for non-sinusoidal signals it provides an approximation. |
The currently selected parameter and coupling mode are indicated by the illuminated LEDs on the meter panel. When wire currents are not enabled, the Ia and Ib parameters are hidden from the meter panel entirely and the parameter button cycles through the voltage modes only.
Min/Max Display
In DC coupling mode, a secondary readout below the main display shows the minimum and maximum values recorded since the last reset. This captures the full range of a signal over time — for a periodic waveform, the min and max will converge on the lower and upper bounds of the signal.
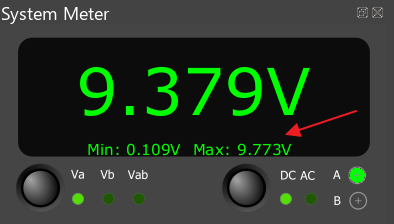
The min/max display shows the range of values recorded since the last reset.
The display resets automatically when a probe is moved to a different net, the measurement parameter is changed, or the coupling mode is switched. You can also reset it manually at any time by double-clicking on the min/max text. This is particularly useful when you have changed a circuit parameter interactively — for example, adjusting a potentiometer — and want to observe the new range from a fresh starting point.
The min/max display is available in DC coupling mode only.
Launching the System Meter
The system meter is available from the animation control panel during interactive simulation. Click the meter icon to open the instrument.

The system meter icon on the animation control panel.
By default, the meter opens docked at the bottom of the editor window. You can detach it to create a floating window by dragging the title bar away from the dock area, and you can resize the floating window as needed. To re-dock the meter, drag it back to a dock area at the edge of the editor.
Live Probing
Live probing works in the same way as for the system oscilloscope. During a running simulation, click on one of the probe buttons (A or B) on the meter panel. The probe will follow the mouse cursor on the schematic. Click on a wire to connect the probe to that net.
To connect a live probe:
- Start the simulation.
- Open the system meter from the animation control panel.
- Click a probe button (A or B) on the meter panel. The probe follows the mouse on the schematic.
- Click on the wire you wish to probe.
The probe icon on the schematic turns green when connected to an analogue net and blue when connected to a digital net. You can move a probe at any time by clicking its button again and placing it on a different wire, or by dragging the probe icon directly on the schematic. Probes persist across simulation runs and Proteus sessions.
You cannot attach a live probe to a bus.
A single voltage probe provides a useful reading because all voltages in a SPICE simulation are defined with respect to the ground node. Placing probe A on any net reads the potential at that point relative to ground. To measure the potential difference between two arbitrary points, use both probes and select Va-Vb mode.
A single current probe is equally straightforward. When wire currents are enabled, the simulator inserts a virtual ammeter in series with the probed net. The probe reads the current flowing through this ammeter and displays it as an absolute value. The direction of current flow is shown by the animated wire arrows on the schematic.
Current measurement is available on analogue nets only. Probing a digital net in current mode will always return a reading of zero.
See Also:
Using the System Meter
In this section we will explore the system meter by taking voltage and current measurements on a 555 timer configured as an astable oscillator.
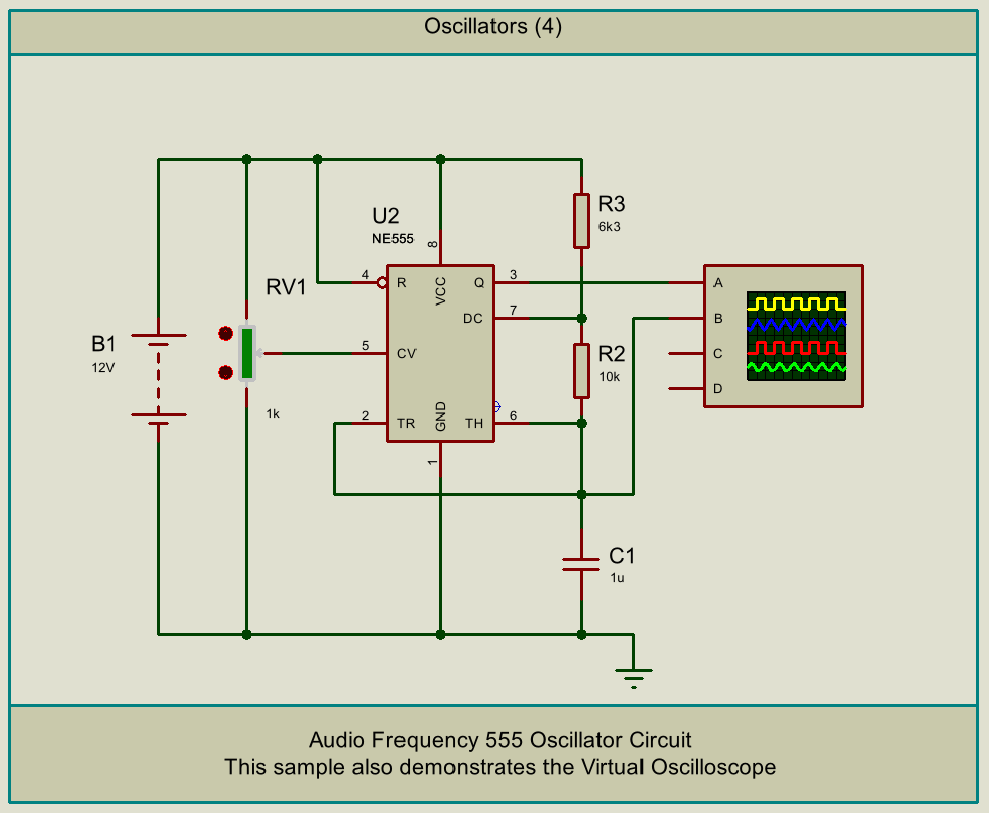
A 555 astable oscillator with a 12V supply, timing resistors R3 (6.3kΩ) and R2 (10kΩ), and timing capacitor C1.
The circuit is built around a 555 timer (U2) configured in astable mode. Resistors R3 and R2 and capacitor C1 form the timing network, and the 555's internal discharge transistor on pin 7 controls the charge-discharge cycle. Potentiometer RV1 is connected to pin 5 (CV), which controls the comparator threshold voltages inside the 555 and shifts them from the standard ⅓ and ⅔ VCC levels. This produces a continuous oscillation on the output at pin 3. At the default component values, the oscillation is far too fast to follow on a numeric display.
Measuring Voltage
Start the simulation and open the system meter from the animation control panel. The meter defaults to Va mode with DC coupling.
Click on probe A and place it on the output at pin 3 of the 555. In DC mode, the reading jumps rapidly as the output toggles between approximately 0V and 12V. The oscillation is too fast to follow on a numeric display — you will see a flickering reading but it is difficult to observe the actual transitions.
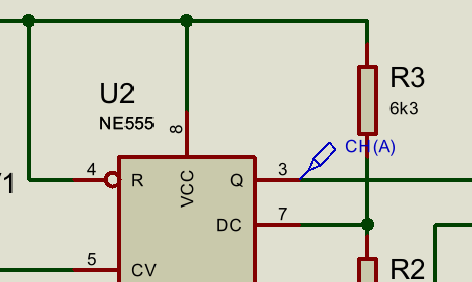
Probing the 555 output. The reading changes too rapidly to follow on the meter display.
To make the measurements more observable, let us slow the oscillator down. Stop the simulation, right click on capacitor C1 and edit its value from 1µ to 100µ. This slows the oscillation to roughly one complete cycle every one to two seconds, depending on the position of RV1.
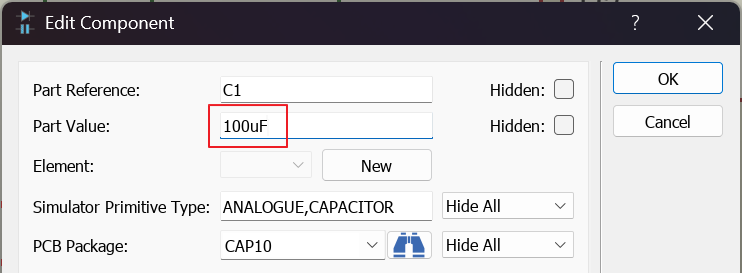
Changing C1 from 1µF to 100µF to slow the oscillation.
Restart the simulation and place probe A on the capacitor node, (the wire connecting pin 6 (TH), pin 2 (TR) and C1). Now you can watch the voltage ramp steadily as C1 charges. Because RV1 modifies the control voltage on pin 5, the thresholds are shifted from the standard ⅓ and ⅔ VCC levels. In practice you will see the capacitor voltage swing between approximately 3V and 6V. When the voltage reaches the upper threshold the 555 triggers and C1 begins to discharge through R2. The reading falls back towards the lower threshold before the cycle repeats.
After a few cycles, the min/max display settles to show these threshold values directly — approximately 3V minimum and 6V maximum. This gives you the bounds of the oscillation at a glance, without needing to watch the main readout and catch each peak.
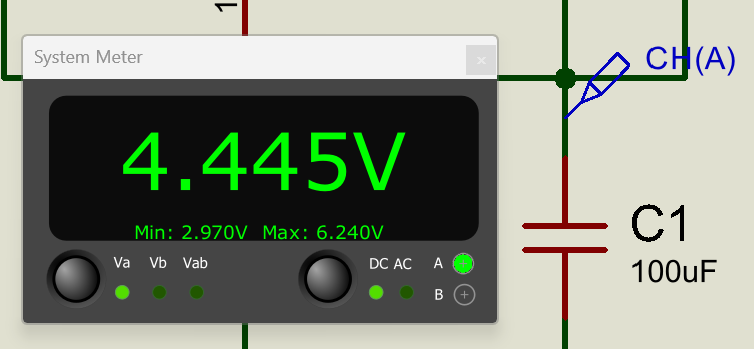
The meter displays the slowly ramping capacitor voltage. The min/max readout captures the lower and upper switching thresholds.
Now move probe A to the pin 3 output. The reading holds at 12V during the high phase and drops to 0V during the low phase, with each state lasting roughly one second. The min/max display confirms the full rail-to-rail swing from 0V to 12V. The transition is clearly visible on the meter at this frequency.
Next, let us measure the voltage across a specific component. Switch the parameter to Va-Vb by clicking the parameter button until the Vab LED is illuminated. Place both probes, one on either side of R2. The reading now shows the voltage drop across R2, and it swings between positive and negative values as the circuit oscillates.
- During the charging phase, the 555's discharge transistor is off and current flows through R2 from pin 7 towards the capacitor. Probe A (pin 7) sits above probe B (the capacitor node) by the IR drop across R2, so the reading is positive, peaking at approximately +5.5V.
- During the discharging phase, the discharge transistor turns on and pulls pin 7 to near ground. The capacitor is still charged, so probe B is now at a higher potential than probe A. The reading swings negative, reaching approximately -6V.
The sign reversal on the meter directly reflects the reversal of current flow through R2 between the charge and discharge phases.
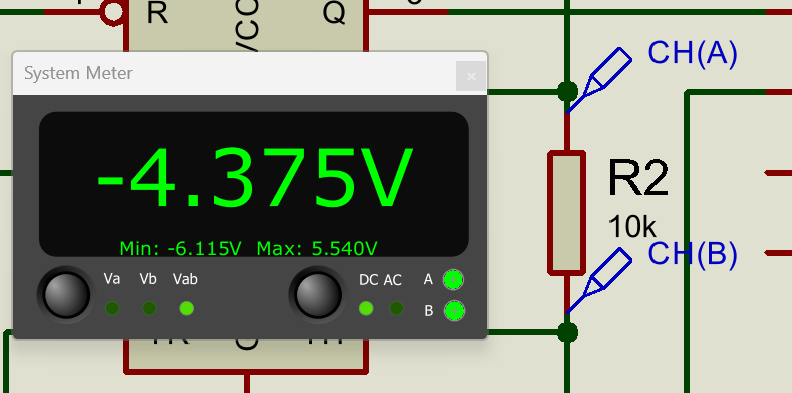
Using Va-Vb mode to measure the voltage across R2. The reading swings between positive and negative as the current through R2 reverses between charging and discharging.
The meter also offers AC coupling, which removes the DC component from a reading and displays an RMS-equivalent value. AC coupling operates on analogue nets only — on a digital net such as the 555 output at pin 3, the coupling setting has no effect and the reading remains the same.
Measuring Current
To measure current we first need to enable wire currents. Stop the simulation and open System > Set Animation Options. Tick Show Wire Current with Arrows and click OK.
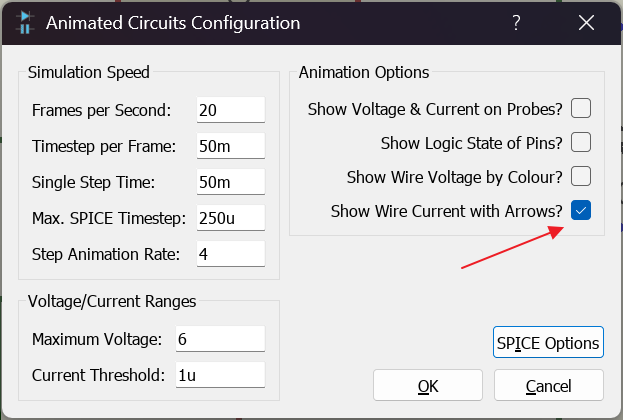
Enabling wire current arrows in the Animated Circuits Configuration dialogue.
Restart the simulation. You will see animated arrows appear on the schematic wires indicating the direction of current flow. The Ia and Ib parameters also become visible on the meter panel.
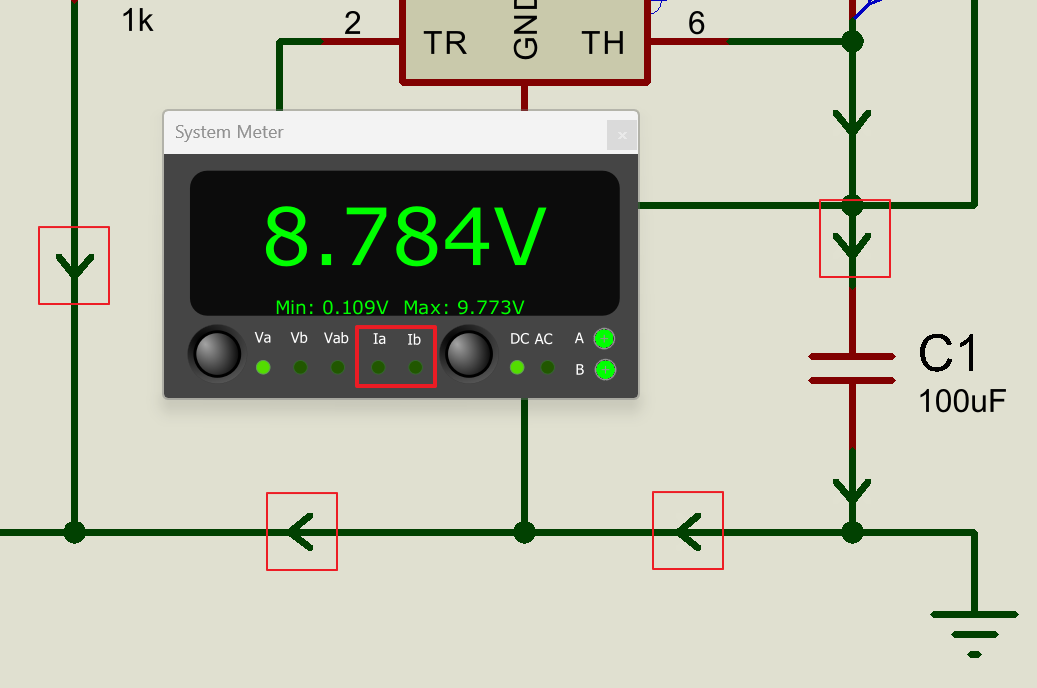
With wire currents enabled, animated arrows show current direction and the Ia and Ib parameters appear on the meter.
Click the parameter button to switch to Ia.
Place probe A on the wire between R3 and pin 7 of the 555. This wire sits on the path between the supply resistor and the timer's discharge pin. Watch the reading as the circuit oscillates. During the discharge phase, the 555's internal discharge transistor turns on and pulls pin 7 close to ground. Current flows from the 12V supply through R3 into pin 7, and the meter reads approximately 1.9mA — consistent with 12V across 6.3kΩ. During the charging phase, the discharge transistor turns off but R3 still feeds the charging path through R2 to C1, so the current drops but does not reach zero.
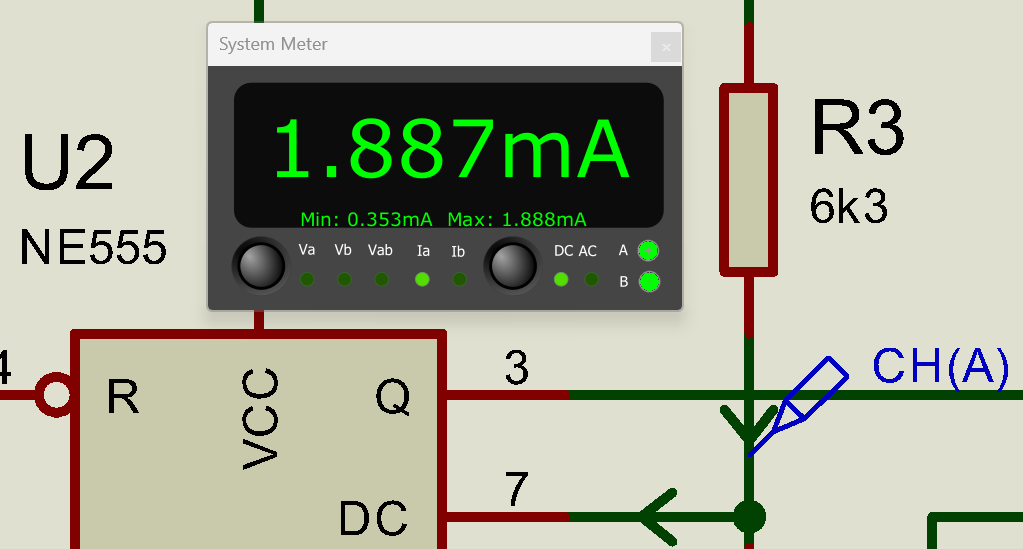
Measuring current on the wire between R3 and the discharge pin. The reading peaks at approximately 1.9mA during the discharge phase and drops to around 0.35mA during charging.
Now move the probe to the wire between R2 and C1. This wire carries the current flowing into and out of the timing capacitor and gives a more revealing picture. The current peaks at approximately 0.6mA midway through each phase and falls slowly towards zero as the capacitor approaches each switching threshold. At the threshold, the 555 triggers, the current reverses direction — watch the wire arrows change — and the cycle repeats. The pattern is roughly symmetrical between the charge and discharge phases.
Notice that the meter reading remains positive throughout; it always shows the absolute value. The direction of flow is indicated by the animated arrows on the schematic.
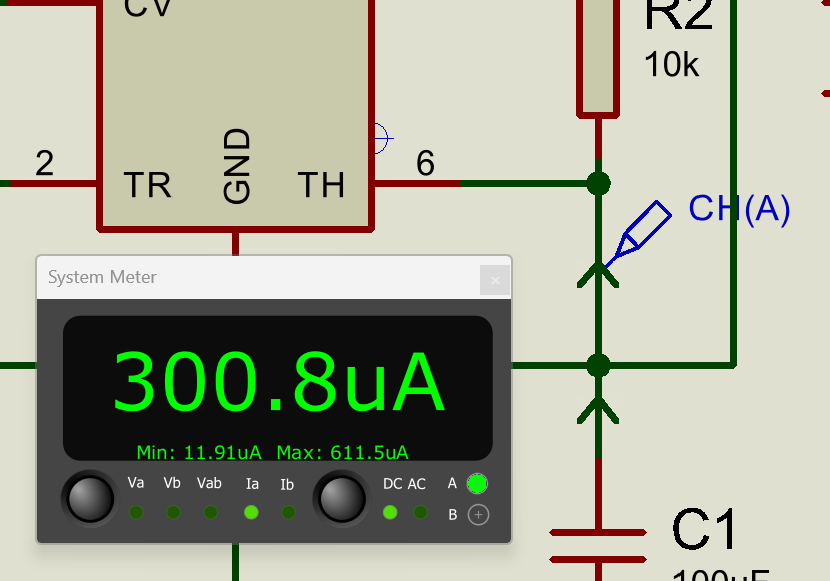
Current on the R2/C1 wire peaks midway through each phase and falls to near zero at the switching thresholds. Wire arrows indicate the direction of flow, which reverses between charging and discharging.
You will notice that the current reading changes continuously as the circuit oscillates — the meter shows the instantaneous value at each moment. To see how circuit parameters affect the current, try adjusting potentiometer RV1 while the simulation is running. Click on RV1 and use the keyboard to increase or decrease its setting. This changes the control voltage on pin 5 of the 555, which shifts the comparator thresholds and alters the voltage range over which C1 charges and discharges.
As you adjust the pot you will see both the oscillation speed and the peak current change. The min/max display still holds the range from the original pot position. Double-click the min/max text to reset it, then let the oscillation settle for a few cycles — the display will show the new minimum and maximum at the updated pot setting. Try different positions and watch how the range changes.
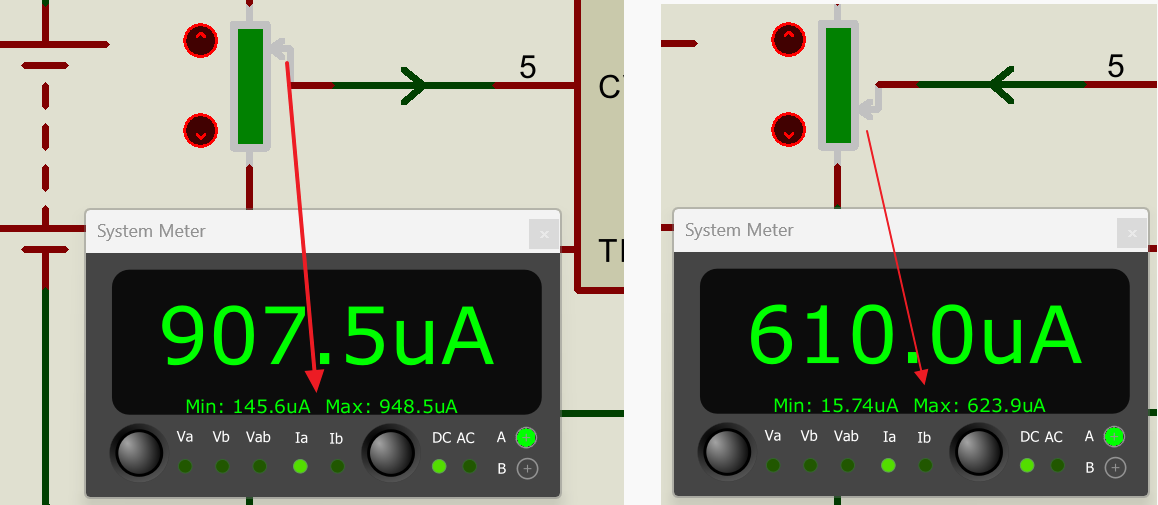
Adjusting RV1 during simulation changes the control voltage, affecting both the oscillation speed and the current magnitude.
Current measurement via the system meter is available on analogue nets only and is intended as an educational aid for understanding current flow in a circuit. For precise current analysis, consider using a placed ammeter component or a current probe on a simulation graph.