INTRODUCTION
Introduction
The aim of this tutorial is to take you through the process of entering a circuit of modest complexity in order to familiarise you with the techniques required to drive the schematic capture module in Proteus. The tutorial starts with the easiest topics such as placing and wiring up components, and then moves on to make use of the more sophisticated editing facilities, such as creating new library parts.
An accompanying tutorial in the PCB module then continues the project development using the completed schematic drawn in this tutorial.
For those who want to see something quickly, dsPIC33_REC_schematic.pdsprj contains the completed tutorial circuit but no layout, while dsPIC33_REC_unrouted.pdsprj and dsPIC33_REC_complete.pdsprj both contain a completed schematic and a PCB. All of these projects can be loaded from the Open Sample command on the Proteus home page under the tutorials category.
You do not have to draw every last part of the circuit to get value from the tutorial. If at any point you feel that you have mastered the drawing techniques, you can pick up the completed schematic when we reach the Design Verification section: that is the one place in the tutorial where we stop and load it for you. Everything after that point works just as well with the pre-supplied design as it does with your own.
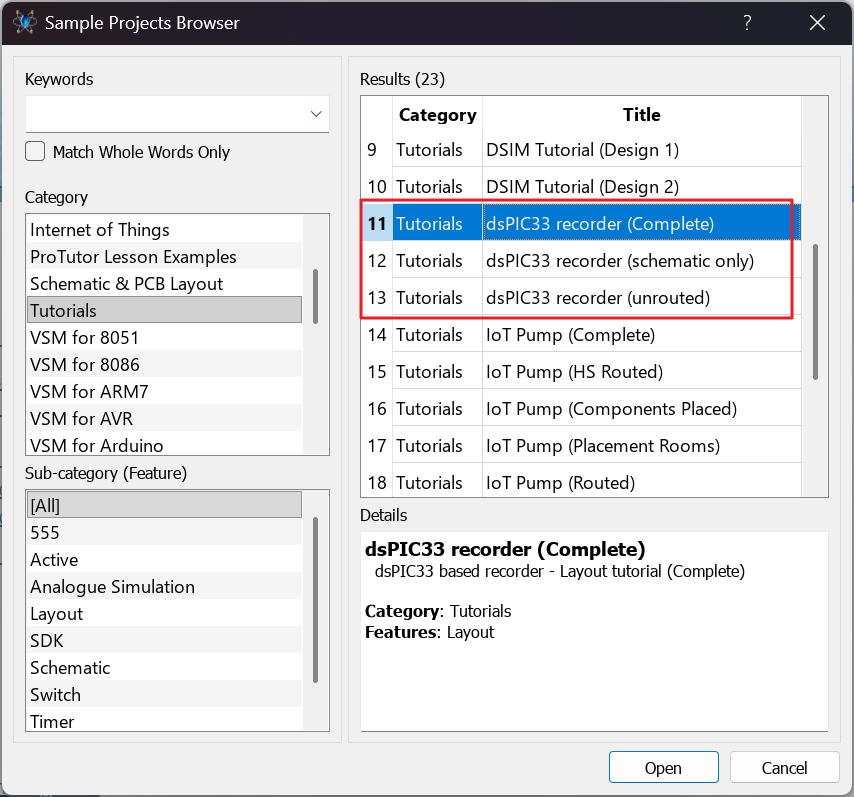
The Sample Projects Browser, with the dsPIC33 recorder projects listed under the Tutorials category
Note that throughout this tutorial (and the documentation as a whole) reference is made to keyboard shortcuts as a method of executing specific commands. The shortcuts specified are the default or system keyboard accelerators as provided when the software is shipped to you. Please be aware that if you have configured your own keyboard accelerators the shortcuts mentioned may not be valid. Information on configuring your own keyboard shortcuts can be found in the General Concepts section of the Documentation.
See Also:
Schematic Capture (Reference Manual)
EDAi : ProPilot and ProTutor (Reference Manual)
Application Framework : Backup and Recovery Procedure
Creating a New Project
We shall assume at this point that you have installed the Proteus software package.
Start the software in the normal way from its entry on the Windows Start menu. The main application will then load and run and you will be presented with the Proteus home page.
If you have a Demonstration copy of the software you can start the Proteus application from the Proteus Demonstration entry on the Start menu.
In order to create a schematic we must first create a project. Since this tutorial is partnered with the PCB tutorial we will create a project for schematic/PCB.
See Also :
New Project for VSM Simulation (VSM Tutorial).
Start by pressing the new project button near the top of the home page in Proteus.

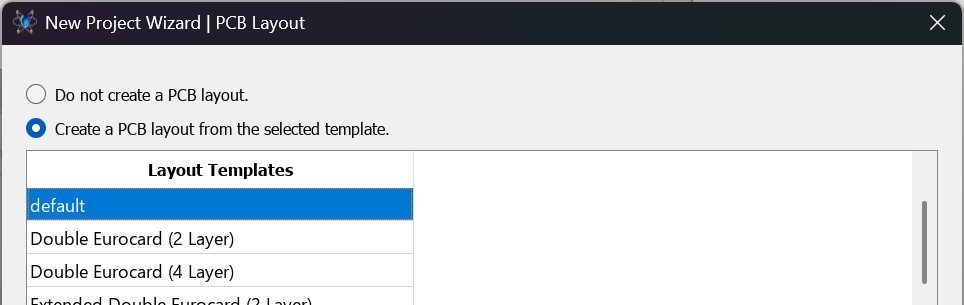
On the first page of the wizard specify a name and path for the project.
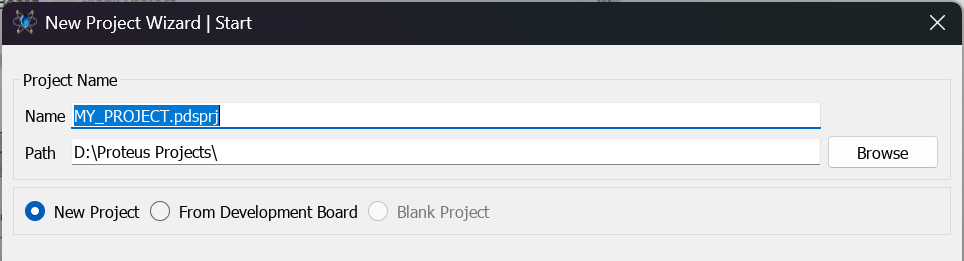
We need a schematic so check the box at the top of the next step and then choose the default template.
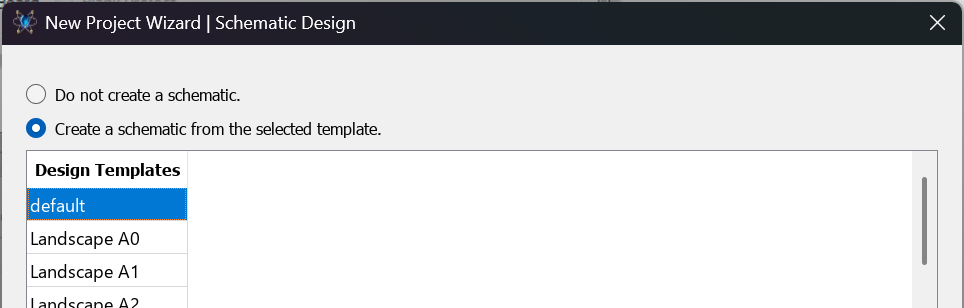
Similarly, we need a layout so check the box at the top of the layout page and again choose the default template.
The next screen allows us to define the layer stack for our PCB. Since we will be designing a simple two layer board there is no configuration necessary here.
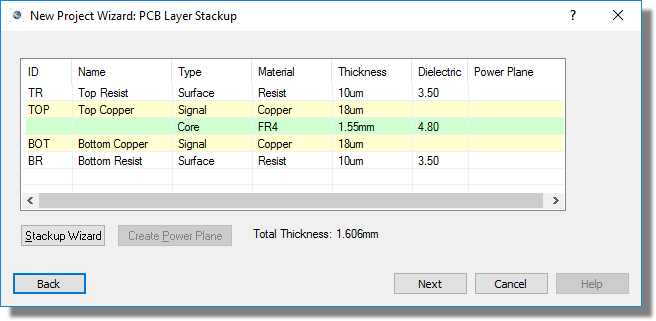
For multi-layer PCB's the stackup wizard button would be used to define the number of copper layers, cores and pre-preg's. This is discussed in more detail in the accompanying PCB tutorial.
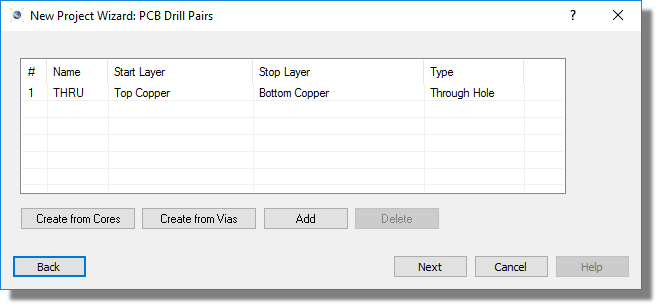
The next screen is for configuration of drill spans. Again, for our proposed 2-layer board the only possibility is thru-hole so there is no action required.
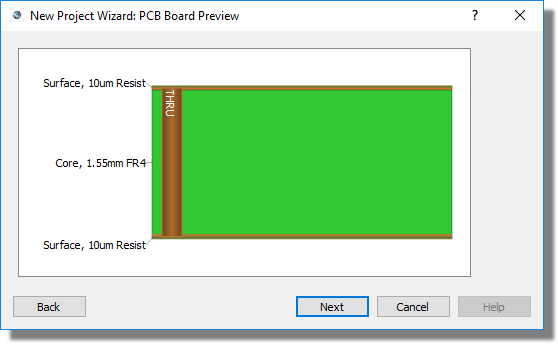
The final screen in the PCB configuration is simply a preview of a PCB cross section that displays visually what has been set up in the previous screens.
We are not simulating the design so leave the firmware page blank and continue on to the summary which should look like the following:
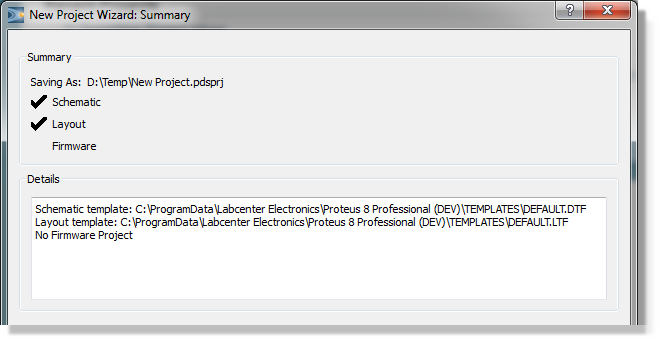
Click on the finish button to create the project
Further Reading:
A schematic template can contain sheet size, colour scheme, company logo, header block and various other aesthetic presets. Further information can be found in the Templates chapter of the reference manual.
A PCB template can contain board edge, mounting holes, design rules, layer stack and various other technology information. Refer to the Templates chapter in the PCB documentation for more information.
The configuration of the Layer Stack and Drill Spans is really important for multi-layer PCB's and is discussed in some detail in the reference manual.
The project will open with two tabs, one schematic capture and the other for PCB layout. Click on the schematic tab to bring the schematic editor to the foreground.
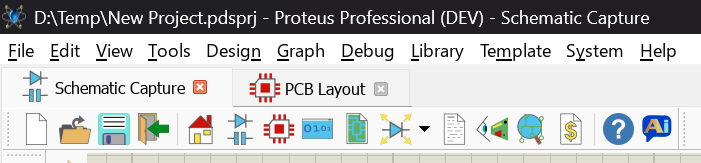
It is worth getting into the habit of saving as you go; CTRL+S saves the project at any time and works from every module. Equally, if an edit goes wrong there is no need to start again: the Undo Changes command on the Edit menu (CTRL+Z) steps back through your recent changes. Between the two of them you can experiment freely as you work through the tutorial.
Guided Tour
The largest area of the screen is called the Editing Window, and it acts as a window on the drawing - this is where you will place and wire-up components. The smaller area at the top left of the screen is called the Overview Window. In normal use the Overview Window displays, as its name suggests, an overview of the entire drawing - the blue box shows the edge of the current sheet and the green box the area of the sheet currently displayed in the Editing Window. However, when a new object is selected from the Object Selector the Overview Window is used to preview the selected object - this is discussed later.
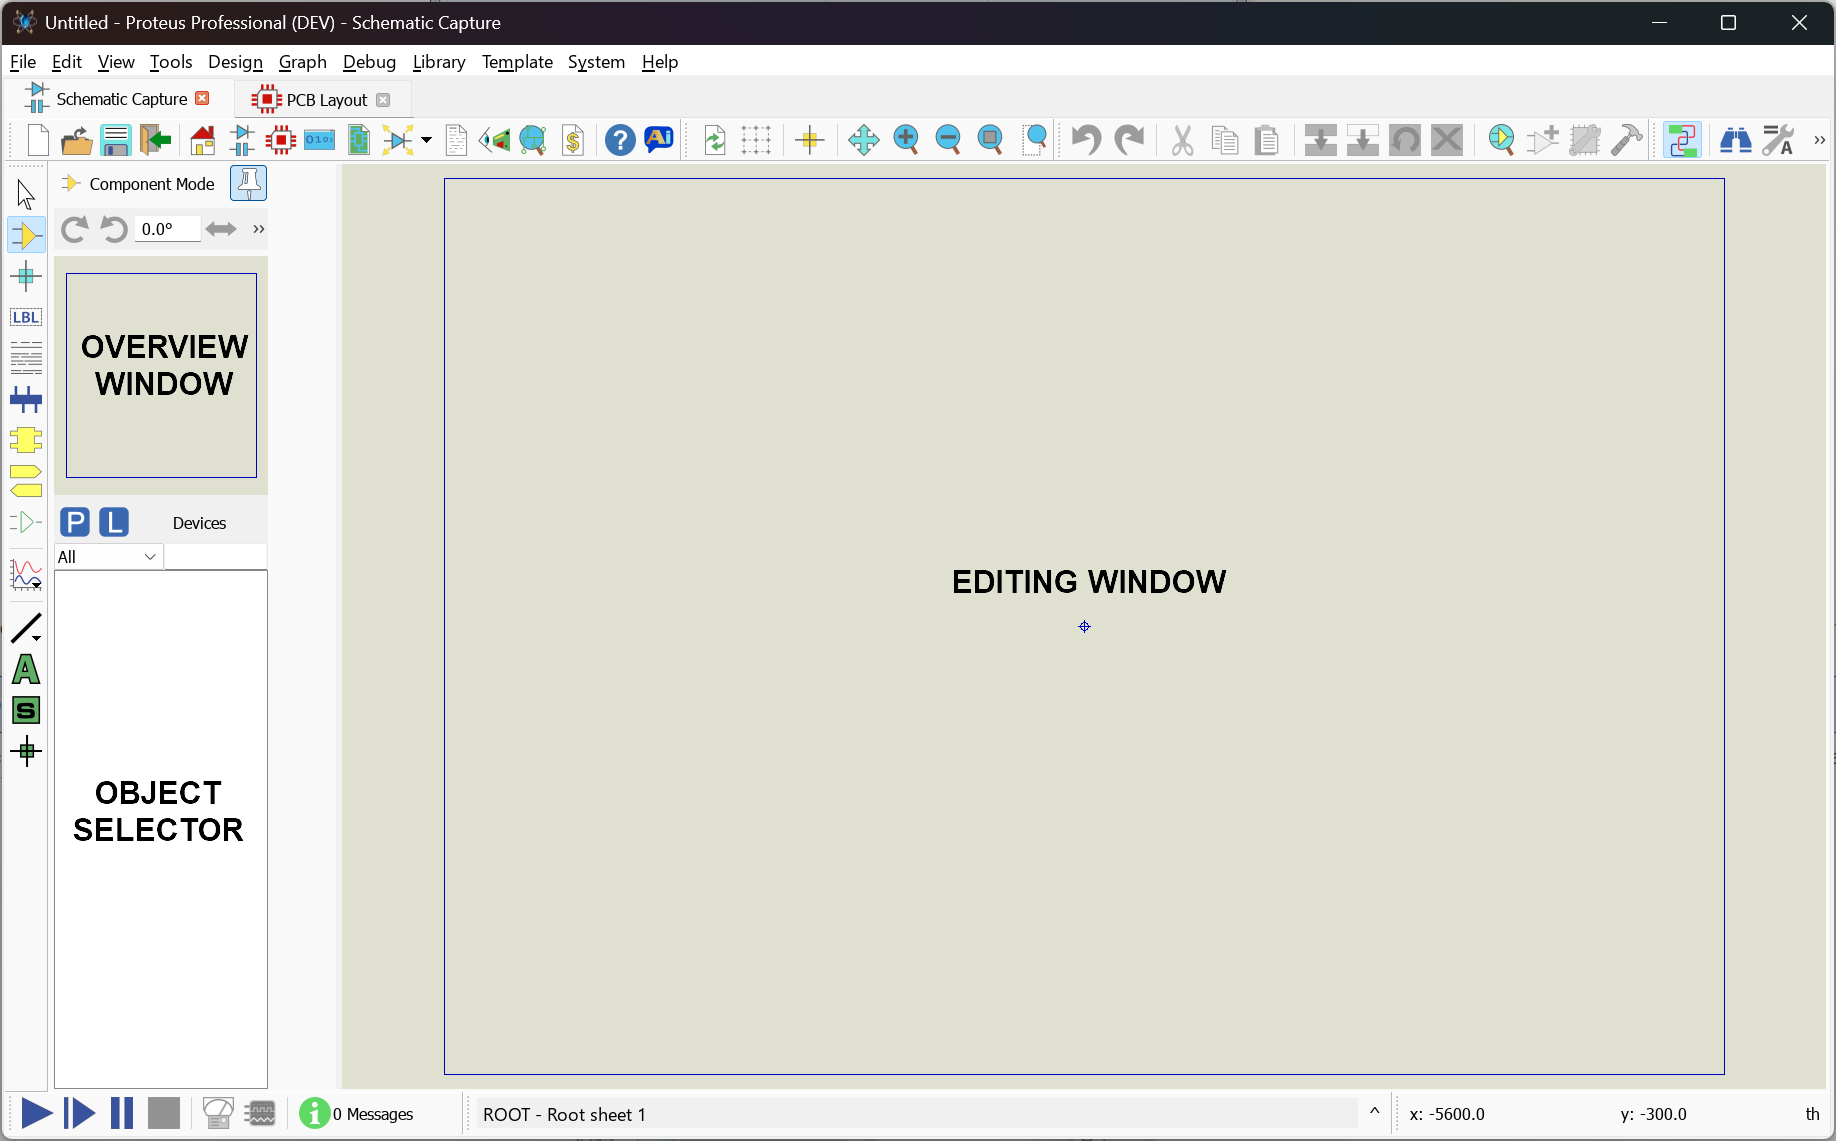
Schematic Capture Window
If you don’t like the default layout of the toolbars you can pick them up and dock them on any of the four sides of the application. Similarly you can move the Object Selector & Overview Window pane across to the right hand side of the application by dragging the end of it all the way across to the other side.
Toolbars and menu options will switch according to which tab is active (at the front). Throughout this tutorial when we refer to an icon or a menu command we are assuming that the schematic tab is active.
Right clicking the mouse either in the Object Selector or in the Overview Window will provide a context menu, including the option to ‘auto hide’ the left hand pane. This is extremely useful if you want to maximise the editing area of the application. When enabled the Object Selector and Overview Window will be minimised to a ‘flyout bar’ at the left (or right) of the application by default and will appear either when the mouse is placed over the bar or when the mode of operation is changed by selecting a different icon.
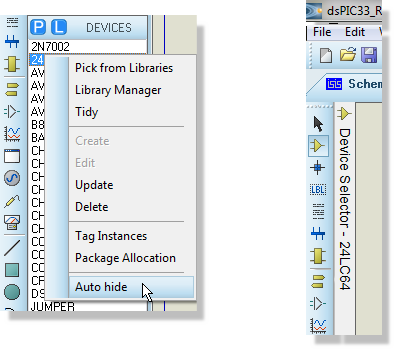
Auto hide the Object Selector Device Mode Icon
One more pane is worth knowing about before we start drawing. If you have configured the AI assistant with your own model and API key, the ProPilot (AI Assistant) command on the Help menu opens a chat side bar alongside the Editing Window. ProPilot can search the Proteus documentation for you and, because it can see the design you have open, it can also answer questions about the schematic itself. It docks like any other pane, so you can leave it open at the side of the screen while you work or close it again when you want the space back. Setting the assistant up is covered in the EDAi manual; we shall point out a few places in this tutorial where it earns its keep.
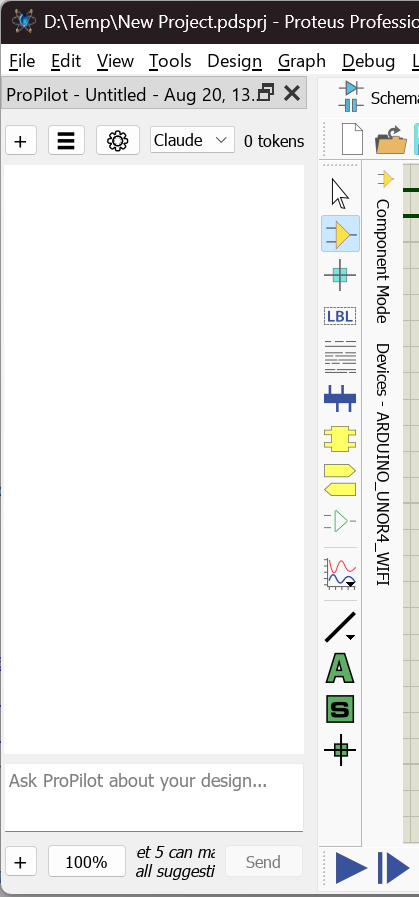
The ProPilot chat side bar docked alongside the Editing Window in the schematic capture module.
See Also:
Screen Layout (Reference Manual)
Working with ProPilot (Reference Manual)
Setting up the AI Assistant (Reference Manual)
Navigation of the view displayed in the Editing Window takes two forms; adjusting the scale of the drawing (zooming) and adjusting the area of the drawing displayed (panning). These techniques are somewhat intertwined and are discussed in more detail below:
Zooming
There are several ways to zoom in and out of areas of the schematic :
- Point the mouse where you want to zoom in and out of and roll the middle mouse button (roll forwards to zoom in and backwards to zoom out).
- Point the mouse where you want to zoom in or out of and and press the F6 or F7 keys respectively.
- Hold the SHIFT key down and drag out a box with the left mouse button around the area you want to zoom in to. We call this Shift Zoom
- Use the Zoom In, Zoom Out, Zoom All or Zoom Area icons on the toolbar.
Zoom Icons
The F8 key can be used at any time to display the whole drawing.
The Shift Zoom and the middle mouse zoom techniques can also be used over the Overview Window. That is, you can position the mouse over the Overview Window and either roll the middle mouse button or use Shift Zoom to navigate in or out of an area of the schematic.
Panning
As with zooming, there are a number of options for panning across the editing window.
- Click on the middle mouse button to enter track pan mode. This puts the schematic in a mode where the entire sheet is picked up and will move as you move the mouse. The track pan cursor will indicate when you have entered this mode. Left click the mouse again to exit track pan mode.
- To simply 'pan' the Editing Window up, down, left or right, position the mouse pointer over the desired part of the Editing Window and press the F5 key.
- Hold the SHIFT key down and bump the mouse against the edges of the Editing Window to pan up, down, left or right. We call this Shift Pan.
- Should you want to move the Editing Window to a completely different part of the drawing, the quickest method is to simply point at the centre of the new area on the Overview Window and click left.
- Use the Pan Icon on the toolbar
Note that when using the track pan method above you can also zoom in and out by rolling the mouse wheel. So, click the middle mouse button to pick up the sheet and move the sheet by moving the mouse and zoom the sheet by rolling the middle mouse button. Left click to 'drop' the sheet and exit track pan mode.
It is well worth spending a few moments familiarising yourself with navigation on the schematic - it is after all one of the most common operations you will perform. In particular, learning to use the middle mouse button both for track pan and for zooming will save you time during schematic design.
A grid of dots or lines can be displayed in the Editing Window as a visual aid using the Grid command on the View menu, or by pressing 'G' to toggle the grid from ‘dots’, ‘lines’ or ‘off, or by clicking the Grid Icon on the toolbar. The grid helps in lining up components and wires and is less intimidating than a blank screen. By default the grid is displayed in light grey, so if you find it hard to see the dots or lines you can change their colour with the Set Design Defaults command on the Template menu.
Below the Overview Window is the Object Selector (sometimes known as a 'parts bin') which you use to select devices, symbols and other library objects. We'll familiarise ourselves further with using the Object Selector later.
Finally, at the bottom of the screen is the co-ordinate display, which reads out the co-ordinates of the mouse pointer when appropriate. These co-ordinates are in 1 thou units and the origin is in the centre of the drawing
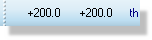
Origin Co-ordinates
Note that Proteus allows you to reposition all the icon toolbars as well as move/resize the Object Selector/Overview Window. Do be aware however, that this documentation refers to all the rebars and windows in their default locations.
Visual Aids to Design
The Proteus capture module is designed to be as user friendly as possible and provides two main ways to help you see what is happening during the design process – objects are encircled with a dashed line or ‘twitched’ when the mouse is over them and mouse cursors will change according to function. Essentially, the object-twitching scheme tells you which object the mouse is over (the ‘hot’ object) and the mouse cursor tells you what will happen when you left click the mouse on that object. While extremely intuitive, a summary of cursors used, together with their actions, is provided below:
| Cursor | Description |
|
|
Standard Cursor - Used in selection mode when not over a 'hot' object. |
|
|
Placement Cursor - Placement of an object will commence on a left click of the mouse. |
|
|
Hot Placement Cursor - Appears green when placement of a wire is available on left click of the mouse. |
|
|
Bus Placement Cursor - Appears blue when placement of a BUS is available on left click of the mouse. |
|
|
Selection Cursor - Object under the mouse will be selected on a left click of the mouse. |
|
|
Move Cursor - The currently selected object can be moved. |
|
|
Drag Cursor - The wire or 2D graphic can be dragged by holding the left mouse button down. |
|
|
Assignment Cursor - When over an object (having set the Property Assignment Tool) You can assign the property by left clicking the mouse button. |


We will see more of the different cursor types throughout the course of the tutorial.
Keyboard Shortcuts
For those customers who prefer to invoke commands and dialogues via the keyboard Proteus provides a comprehensive and flexible scheme for assigning shortcuts. The dialogue form is invoked from the System Menu – Set Keyboard Mapping command, where all commands and operation modes can be accessed from the combo box at the top. Simply select the command you want, apply a key sequence and assign it to that command
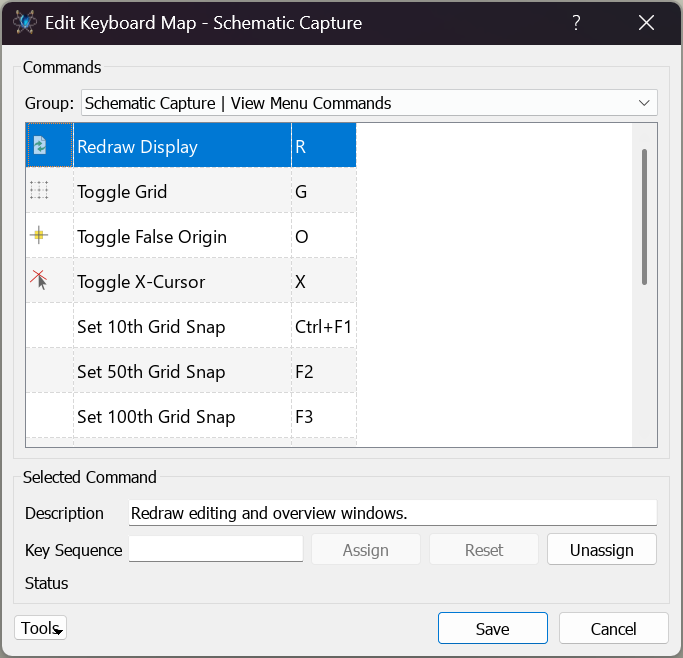
Keyboard Mapping Dialogue Form
While there are few limits on shortcuts, a few standard windows accelerators are restricted as they are global across the entire Proteus system (e.g. CTRL+S for save).
See Also:
Keyboard Configuration (Reference Manual)
Display Options
Proteus is capable of harnessing the power of your computers graphics card to speed up operation and present a crisp and smooth display. However, as not all machines have sufficient graphics cards the software is also capable of using Windows to perform display and graphical operations. Three modes of operation are offered:
- Use Software Graphics.
- Use Open GL Graphics (Hardware Accelerated).
- Use Direct2D Graphics (Hardware Accelerated).
If your graphics card is not powerful enough to support hardware acceleration then Proteus will simply default to Software Graphics mode. Should your computers graphics card be capable of both Direct2D and OpenGL the system will default to Direct2D mode as this tends to be more reliably implemented by graphics card vendors.
Configuration of the screen display takes place from the Set Display Options command on the System menu. Some of these options are specific to a particular hardware acceleration technology and will be disabled when a different mode is enabled.
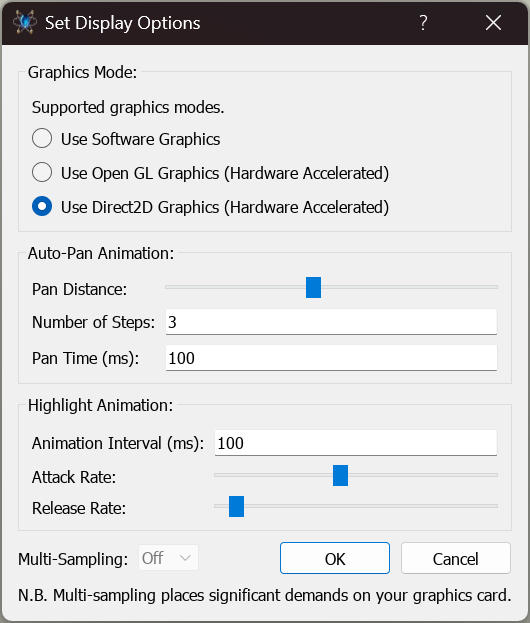
The Set Display Options Form for OpenGL and Direct2D
The first section of the dialogue reports on whether your graphics card will support OpenGL and/or Direct2D hardware acceleration and, if so, allows you to switch between graphics mode.
The auto-pan section of the dialogue allows you to control distance, smoothness and speed of pan operations on the schematic. For example, holding down the shift key and bumping the mouse against the edge of the window will auto-pan the screen.
The highlight animation options allow you to specify the speed at which objects become active when the mouse is moved over them. The attack rate is the rate at which the object is highlighted and the release rate is the speed at which the object returns to it’s default state. These options are only available in hardware accelerated display modes.
Finally, the multi-sampling combo box allows you to specify the level of anti-aliasing you want when working in OpenGL mode. The higher the level of multi-sampling the better the anti-aliasing effect but the more GPU resources are consumed. If you select a level of multi-sampling which is not supported by your graphics hardware the software will reset the level to the closest one which your card can handle.
What you get with multi-sampling varies enormously between graphics cards. Some present extremely smooth text, while with others it looks blurry and on a few it causes display issues. We would suggest you being with multi-sampling off if you choose to work in OpenGL mode.
Configuration of colours and styles on the schematic takes place from the Template Menu. This allows to change everything from paper, grid and highlight colours to the thickness and colour of all the object types used in a design. Please refer to the reference manual section on Templates for more information.