Debug Console
Introduction
When simulating a microPython project in Visual Designer, a debug console automatically opens. This console is is abstracted from any hardware (and therefore consumes no pins on the device). It simulates the connection of a real board to a USB based COM port on the PC.
The debug console supports three key features:
-
Output from
printflowchart blocks -
Connection to Python Runtime messaging.
-
Interactive REPL (Read-Evaluate-Print Loop) mode
Together, these make the debug console an invaluable tool for debugging, testing, and rapid iteration.
You can close the debug console - and open it again later - from the Debug Menu command during a running simulation
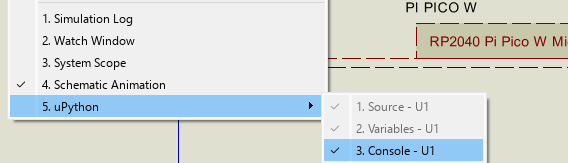
Debug Console Visibility is controlled from the Debug Menu
Python Runtime Messaging
The debug console is connected to the stdin/stdout of the Python runtime. Where appropriate, peripheral drivers write status and error messages to it.
Using Print Blocks for Debugging
Any print flowchart blocks in your program will automatically send their output to the debug console. Since this is entirely abstracted, there’s no need to configure pins or lose a UART peripheral to diagnostic output.
This makes it incredibly easy to track what’s happening inside your program. For example:
- Drop a print("Entered Loop") block inside a loop to verify it runs
- Use print(variableName) to observe changing values during simulation
- Monitor decision branches by printing conditional paths
These messages appear instantly in the debug console, allowing you to trace program flow and identify issues.
Tip: Use different messages or prefixes in your print statements to distinguish between different parts of your logic.
REPL Mode
In addition to receiving output, the debug console can also send input to the simulated microPython interpreter via REPL mode — a powerful feature unique to microPython development.
Keyboard Operations:
Arrow Up/Down — browse command history (50 entries).
Arrow Left/Right — move cursor within line.
Ctrl+P/N — previous/next history (Emacs bindings, already enabled).
Ctrl+A/E — jump to start/end of line.
Ctrl+B/F — move backward/forward one char.
Ctrl+K — kill from cursor to end of line.
Ctrl+U — kill from start of line to cursor.
Tab — auto-complete Python identifiers.
Ctrl+C - Break program(edited).
To enable REPL input:
- During Simulation, press CTRL + C to exit the current running program (Not simulation).
- You need to import the Pin Variable by typing the following:
from machine import Pin
pin0 = Pin(0, Pin.OUT)
pin0.value(1)
- Type REPL commands directly - for example: print("Hello from REPL")
- Observe the command effects on the simulated system in real time
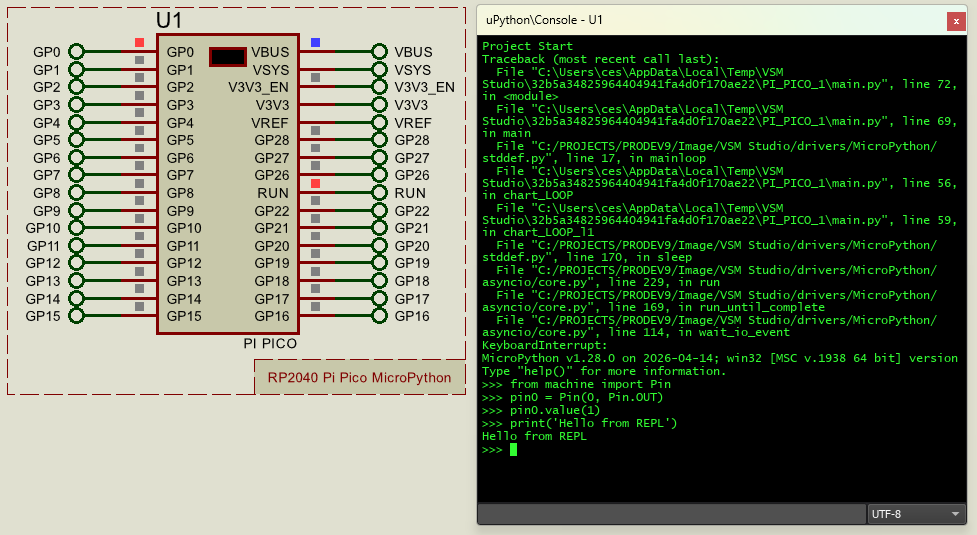
Basic REPL Setup on the microPython Debug Console
REPL mode is really helpful for both debugging and testing - it's basically an interactive command prompt. For example, you can:
-
Test control logic live
Set pin values, start PWM, or invoke functions while the simulation is paused or running. -
Read sensor data
If your schematic includes simulated sensors, you can query input states or read ADC values. -
Inspect variable state
Assuming you've declared variables in the flowchart, you can often reference them directly if they are exposed in the microPython environment. -
Debug incrementally
Pause the simulation and use REPL to "poke" the system — a quick way to test ideas without changing your flowchart.
Limitations
-
REPL runs in the context of the simulation, not the static flowchart program. Think of it as an overlay tool for testing and diagnosis.
-
You may not have access to all symbols or flowchart variables unless they’re globally scoped and visible to the interpreter.
-
If the simulation is stopped or reset, any state in REPL is lost.