CAN EXAMPLES
Overview
This topic is a set of worked examples that show how to drive a CAN network in a Proteus VSM simulation, from simply watching the traffic through to injecting faults and writing the firmware that recovers from them. Each example is a short, numbered procedure. They build in difficulty, but each one stands on its own, so you can start with whichever capability you want to see.
Two kinds of example appear below. Some open a ready-made sample design that ships with Proteus; the procedure begins by simply opening it. Others build a tiny circuit from scratch, and begin by placing a few parts and connecting them. Only the sample designs are installed with the product. The from-scratch examples can be built in a couple of minutes, and where they need firmware it is short enough to reproduce in full.
Every example uses the CAN Bus Analyser as the window onto the bus, and the behavioural nodes (ready-made simulated ECUs) described in CAN Models as the traffic around your own MCU. Load the supplied .dbc on the analyser so that frames decode by name.
Setting Up a CAN Project
Most of the from-scratch examples below begin in the same way: a new project, a microcontroller to carry your firmware, the CAN parts it needs, and a two-wire bus joining everything together. That common setup is described here once, so the examples that build their own circuit can refer back to it rather than repeat it.
- Start a new project and add the microcontroller you will program: a pyboard for MicroPython, or an STM32 part for C. This is your node on the network.
- Open the Pick Devices form and add the CAN parts you need. List them either by typing CAN bus in the Keywords box, or by selecting the Automotive CAN and CAN Controllers sub-categories. Pick the behavioural node or nodes for your example (a lighting cluster, the instrument panel, the engine ECU and so on), a CAN transceiver such as the MCP2551, and the CAN_ANALYZER.
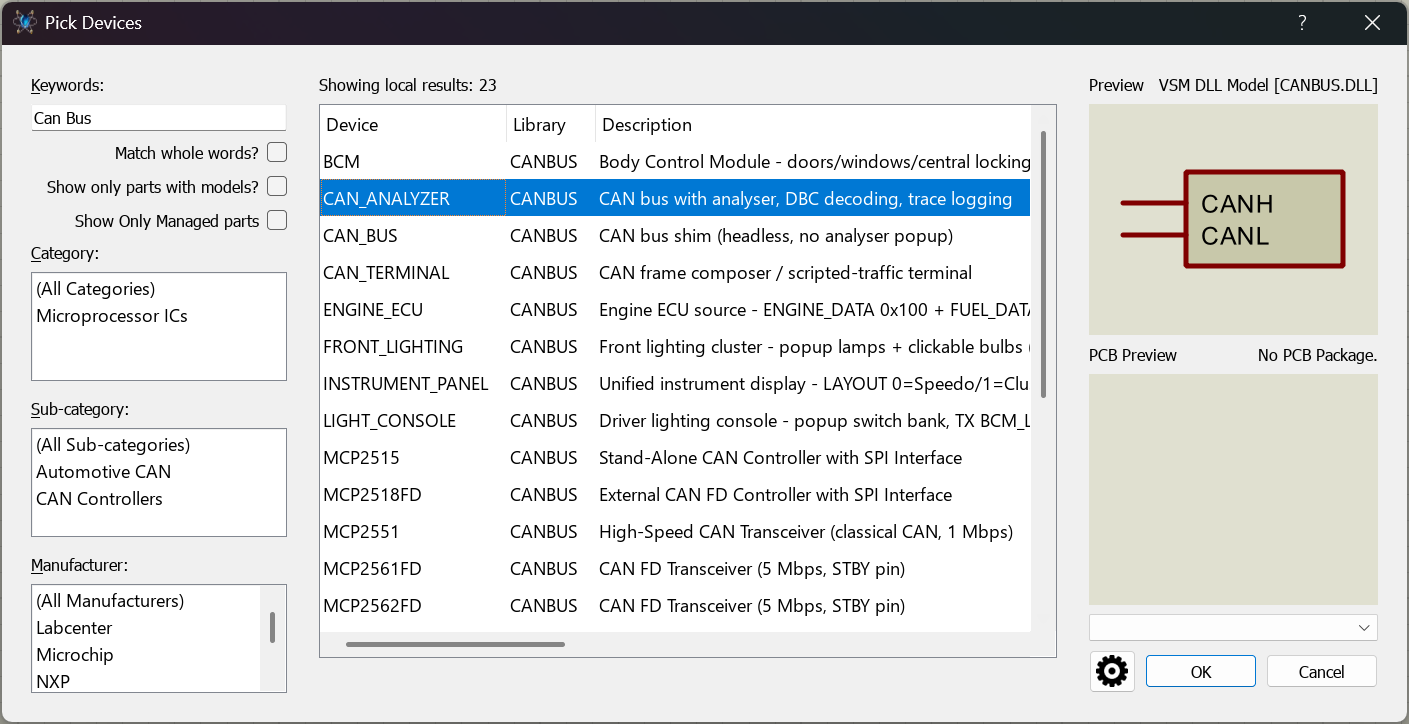
The Pick Devices form with “CAN bus” typed in the Keywords box, listing the CANBUS library parts. - Place the behavioural node (component) or nodes and the analyser on the schematic. i.e. your Front lights, Rear Lights, Engine ECU etc...
- Bring your microcontroller onto the bus through the transceiver: wire the Processor CAN transmit and receive pins to the transceiver, which converts them to the two bus wires. On a pyboard, CAN1 is TX=PB9 / RX=PB8; wire these to the transceiver's TXD/RXD. Because a pyboard or STM32 already has a CAN controller built in, it needs only a transceiver to reach the bus; an MCU without on-chip CAN would instead use a standalone controller such as the MCP2515 over SPI, plus a transceiver.
- Join everything onto one bus with terminals. Attach a terminal labelled CANH to each part's CANH pin and a terminal labelled CANL to each CANL pin, including the transceiver's bus side. Nets of the same name connect automatically, so every part then shares the single CAN bus.
- Load the matching .dbc on the analyser (its DATABASE property) so the traffic decodes by name. The circuit is now ready, and firmware and experimentation can begin as in the examples below.
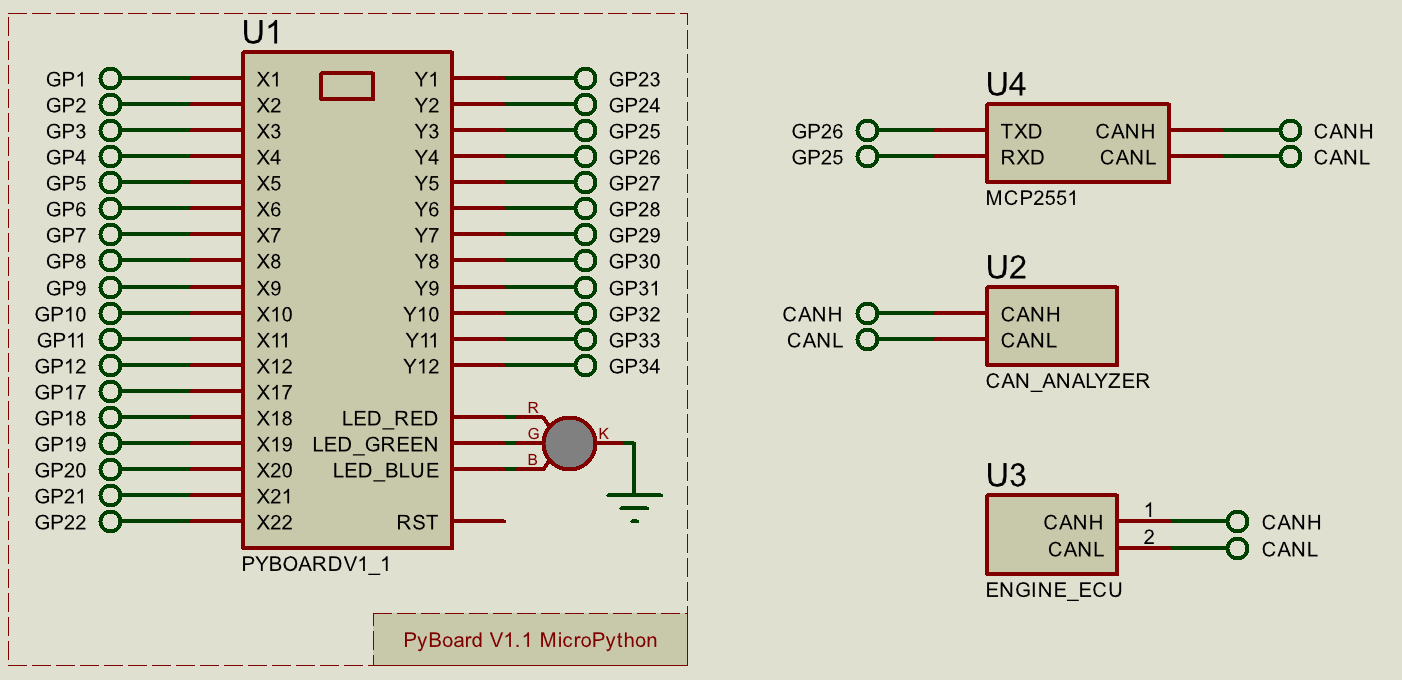
A minimal finished bus: the microcontroller and its transceiver, one behavioural node and the analyser, all joined by CANH and CANL terminals.
Where an example says to build the standard setup, it means the steps above. The only things that change between examples are which microcontroller you program and which behavioural node or nodes you place on the bus.
A node's popup (its control panel) opens automatically when the simulation runs. If you close one, or it does not appear, reopen it from the Debug menu while the simulation is running.
To change a part's property (for example FAULT_MODULE or VALID_IDS below), right-click the part, then left-click it to open Edit Component; type the property name and value, then click OK. To edit or rebuild a pyboard's firmware, use VSM Studio's Source Code tab (main.py).
Example 1: Monitor and Decode the Bus
The starting point for everything else: capture live traffic and read it decoded by name. This example uses a ready-made network so there is nothing to wire.
- Open the sample design can_network.
- Press Run. The CAN Bus Analyser window opens automatically and the Frames tab begins to fill.
- Confirm the analyser has a database loaded (its DATABASE property names the supplied .dbc). Each frame is now listed by message name rather than as raw hex.
- Select a frame to open its bit-level ribbon and see the start, arbitration, data and CRC fields laid out in order.
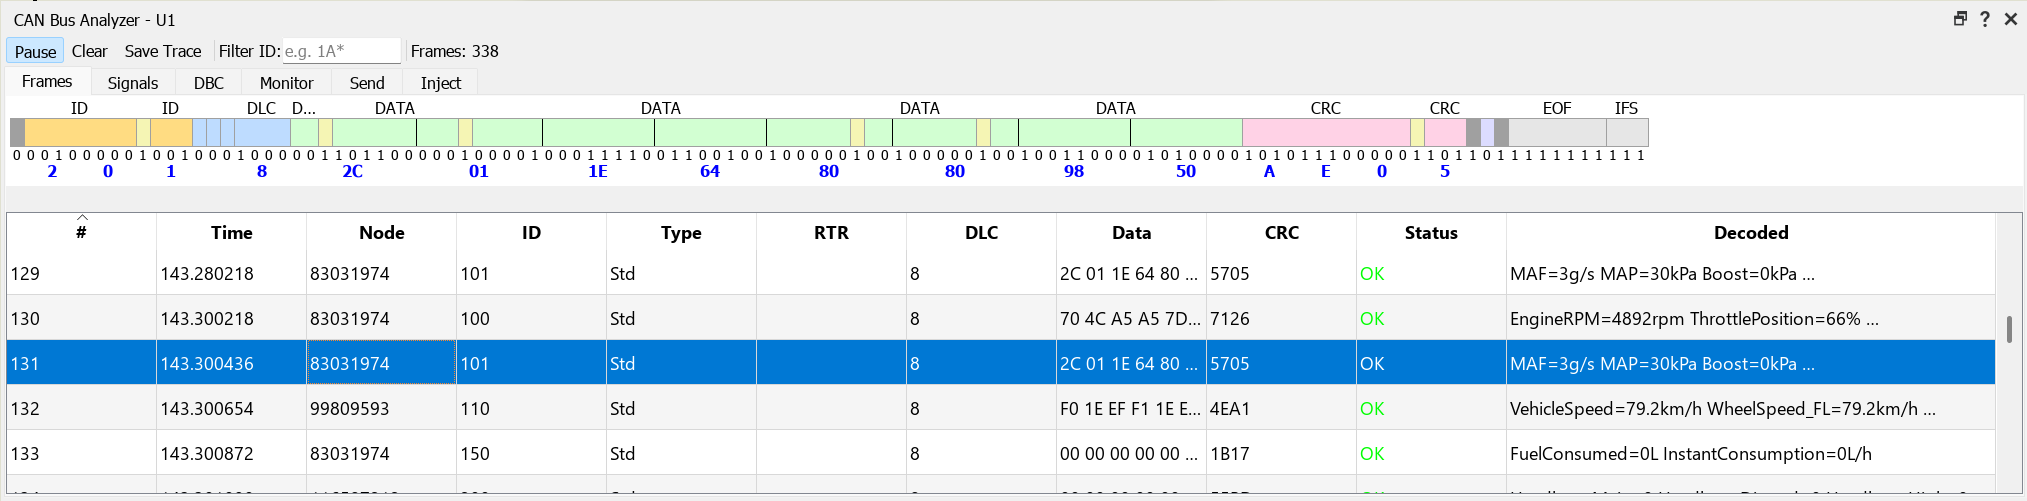
The Frames tab during a run, with several messages decoded by name and one frame selected to show its bit ribbon.
Example 2: Read Live Signals in Engineering Units
Beyond raw frames, the analyser decodes each signal into its real-world value using the loaded database.
- Open the sample design Can Instruments Family and press Run.
- On the analyser, select the Signals tab. Each signal is listed with its live value, units and observed range.
- Open the Engine ECU or Vehicle Dynamics popup and drag a slider. Watch the matching signal (for example engine speed or road speed) update in the Signals tab and the dashboard gauge move in step.
- Switch to the DBC tab to browse the database itself: the nodes, the messages each one sends, and the bit layout of every signal.
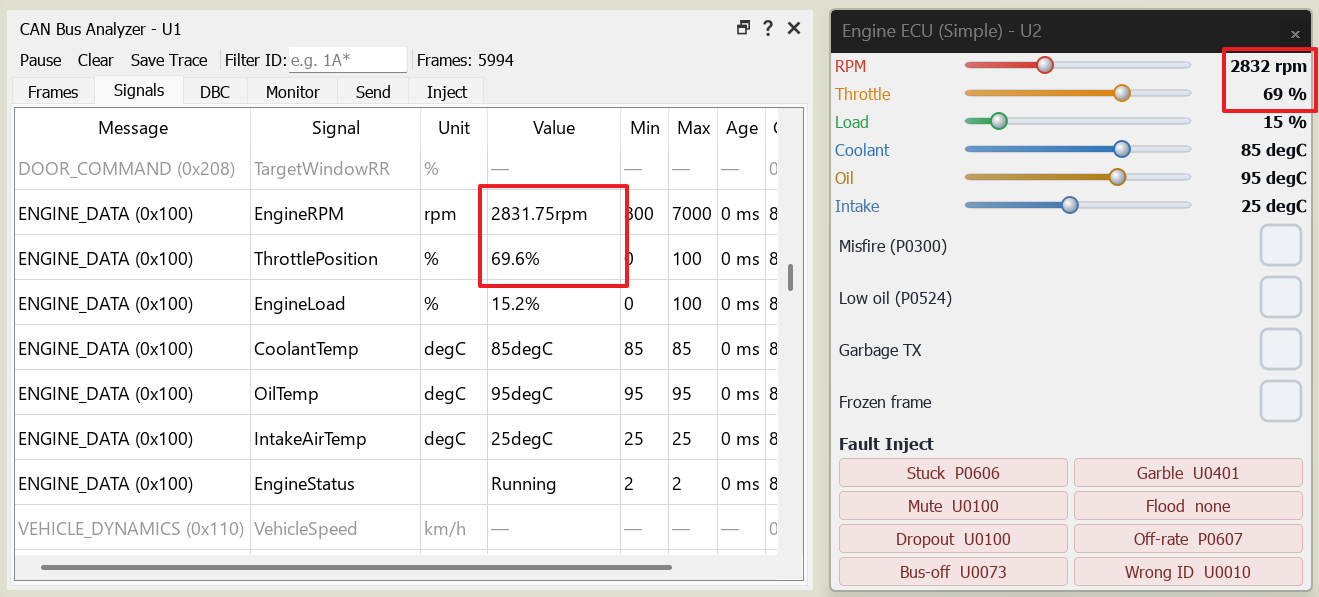
The Signals tab showing decoded values in engineering units, beside the dashboard popup with a gauge mid-sweep.
Example 3: Transmit a Frame by Hand
The analyser is not only a monitor: it is an active node that can place your own frames on the bus. This demonstrates bus injection with no firmware at all.
- Open the sample design lighting_body and press Run.
- On the analyser, select the Send tab and enter this frame exactly:
Field Value Meaning ID 0x200 the body-lighting command message Type Standard 11-bit identifier DLC 8 number of data bytes in the frame Data 00 01 00 00 00 00 00 00 byte 1 = 0x01 - the BrakeLight bit Why byte 1 = 0x01 sets the brake bit - the byte's eight bits, numbered 7 down to 0:
bit:    7  6  5  4  3  2  1  0
value:  0  0  0  0  0  0  0  1   = 0x01  <- bit 0 is the BrakeLight bit
- Tick Repeat every, then press Send, so your command holds against the Light Console's own periodic frame. Both brake lamps light in the Rear Lighting Cluster popup, and your frame appears in the capture list, sourced by the analyser. Your hand-built frame drove a node, with no firmware at all.
- Now try a left indicator. The indicator field is bits 6-7 of byte 0; its values are 0 Off, 1 Left, 2 Right, 3 Hazard. Left (1) in that field makes byte 0 = 0x40, so send: ID 0x200, DLC 8, Data 40 00 00 00 00 00 00 00:
bit:    7  6  5  4  3  2  1  0
value:  0  1  0  0  0  0  0  0   = 0x40  <- bits 6-7 = the indicator field, holding 1 = Left
Tick Repeat every (set the interval alongside, in milliseconds) so the frame re-sends periodically, and watch the left indicator flash in the popup.
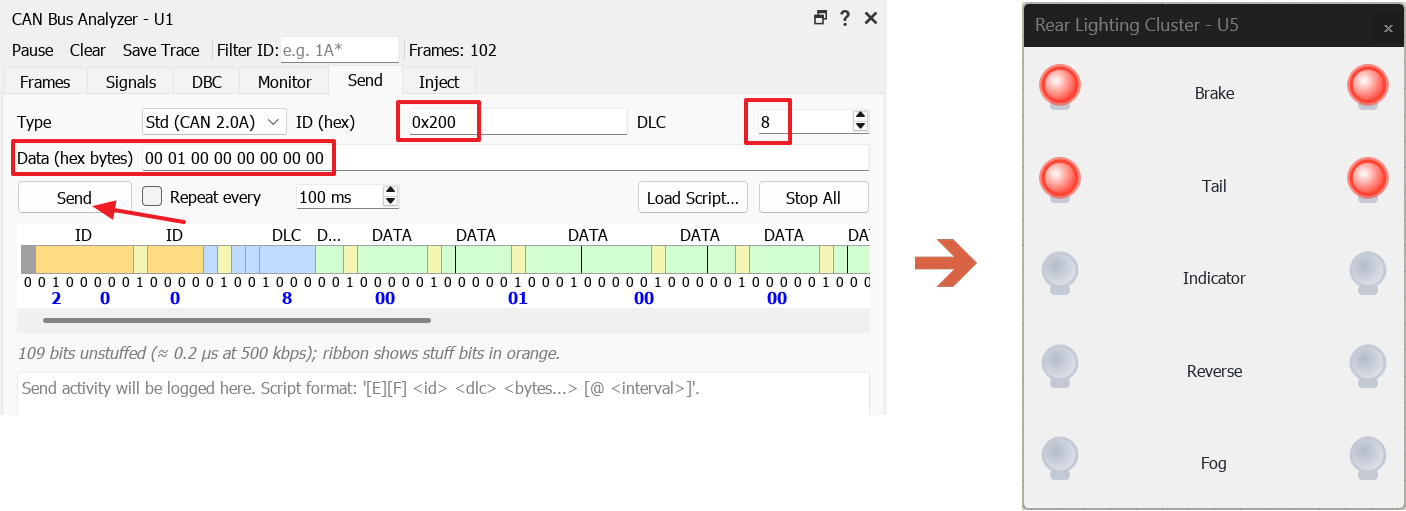
The Send tab with a composed 0x200 frame, beside the lamp popup showing the brake lamps lit by it.
Example 4: Send Messages from Your Own MCU
Now your own firmware becomes the source of the lighting command. This example is built from scratch.
- Build the standard circuit described in Setting Up a CAN Project, using a pyboard for the firmware and a REAR_LIGHTING cluster as the node on the bus.
- Write firmware to broadcast the lighting command. This is all that is needed to set the brake bit:
from pyb import CAN
import time
can = CAN(1, CAN.NORMAL, baudrate=500000)          # bit timing set for 500 kbit/s
while True:
    can.send(b'\x00\x01', 0x200)  # byte 1 bit 0 = BrakeLight on
    time.sleep_ms(50)
- Press Run. The brake lamps light, driven entirely by your code, and the analyser shows your node as the source of 0x200.
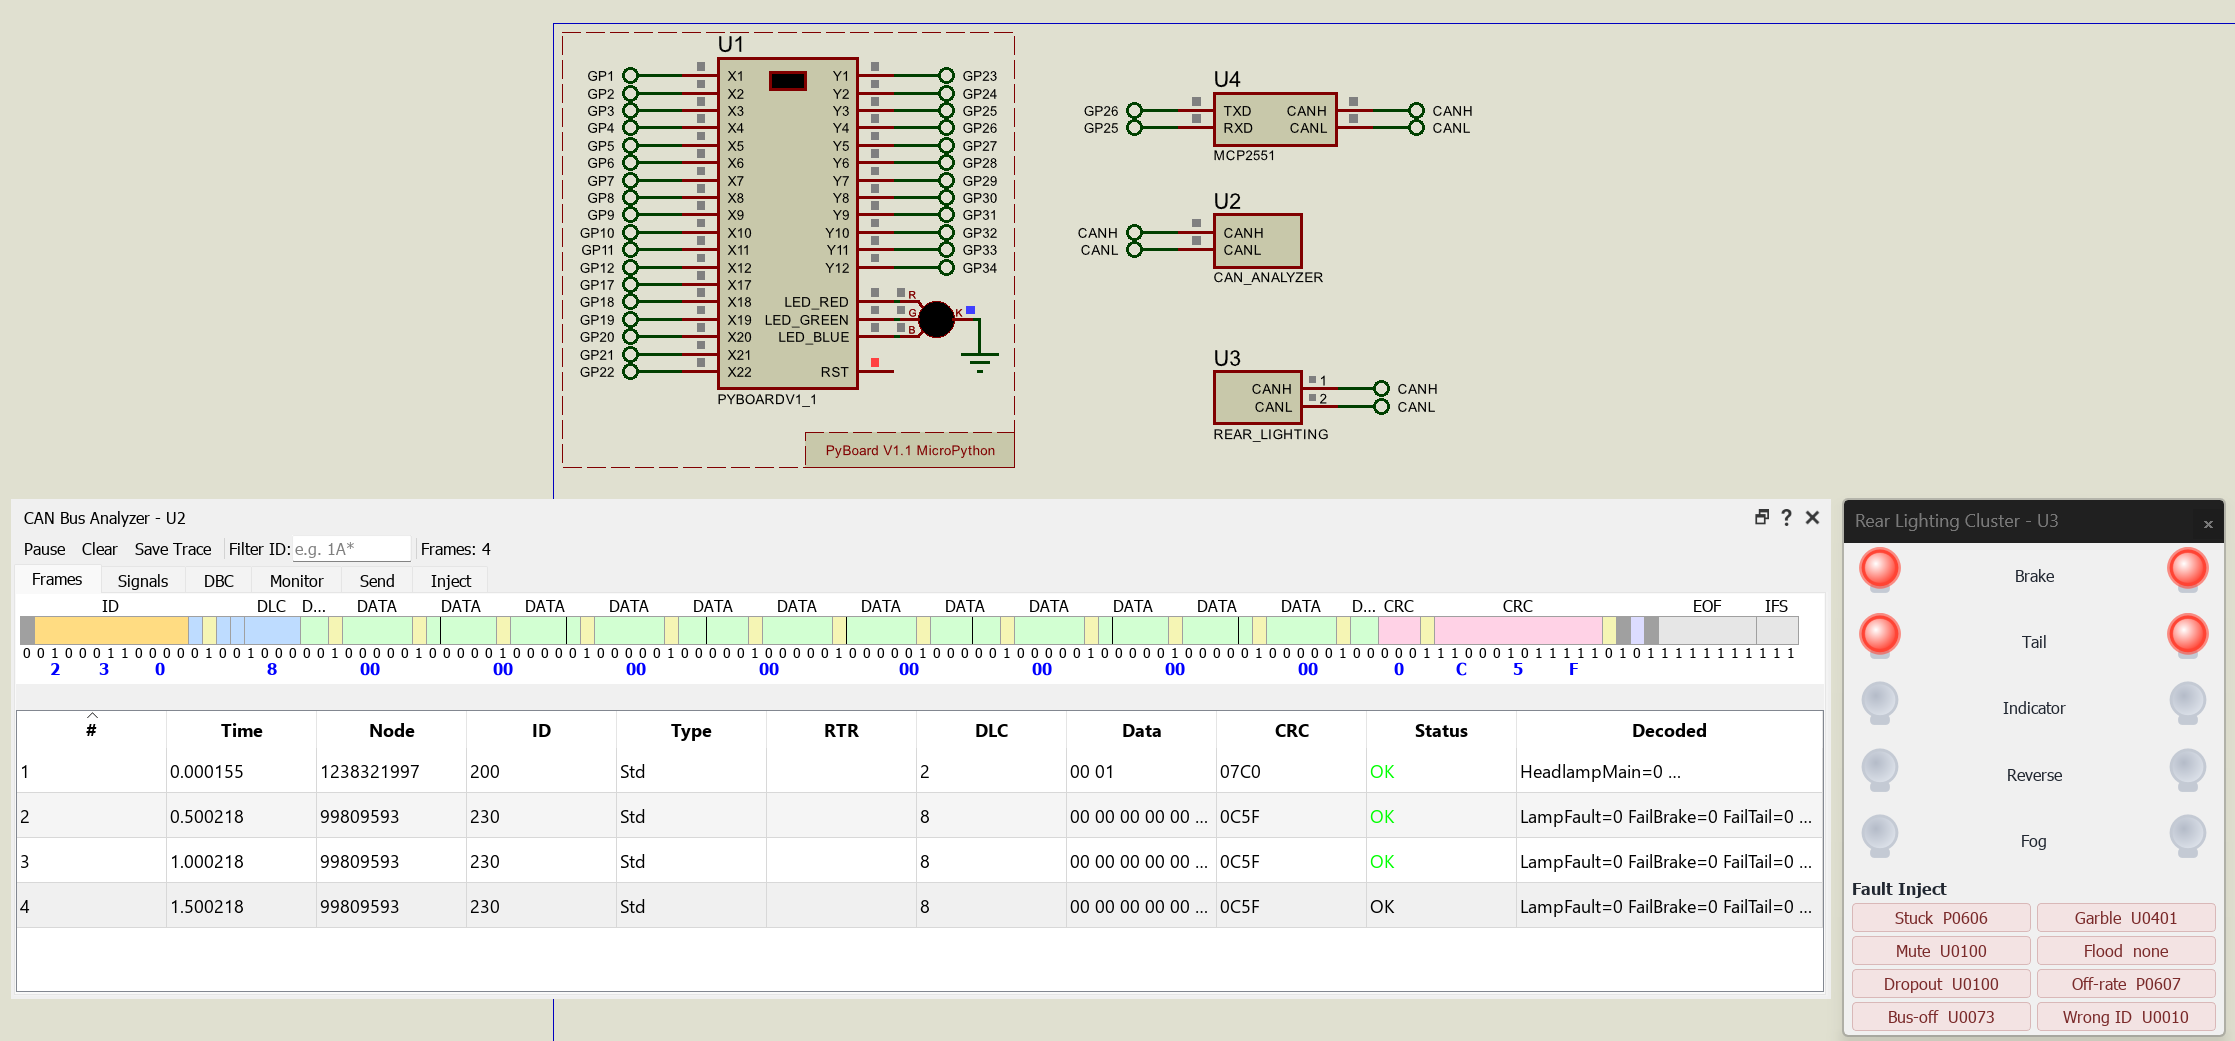
The running simulation: brake lamps lit, with the analyser Frames tab showing 0x200 sourced by the pyboard node.
Example 5: Receive and Act on a Message
The other half of firmware on the bus: receive a broadcast and act on it. Here the pyboard watches road speed and lights an LED above a threshold.
- Build the standard circuit described in Setting Up a CAN Project, using a pyboard for the firmware and a VEHICLE_DYNAMICS node as the source on the bus. Also place an LED, with a series resistor to GND, on pyboard pin X1.
- Copy and paste the following code in to your VSM Studio project. This build's pyb module is CAN-only (no pyb.LED/pyb.Pin), so the LED is driven through machine.Pin instead, using its string pin name:
from pyb import CAN
from machine import Pin
import time
ID_VEHICLE_DYNAMICS = 0x110  # = 272 ; carries VehicleSpeed (vehicle.dbc)
SPEED_THRESHOLD = 30         # km/h - LED turns on at or above this speed
can = CAN(1, CAN.NORMAL, baudrate=500000)  # CAN(1): TX=PB9, RX=PB8, 500 kbit/s
can.setfilter(0, CAN.MASK16, 0, (0, 0, 0, 0))  # FIFO 0, accept every ID
led = Pin('X1', Pin.OUT)  # LED + series resistor to GND on pin X1
led.off()
print("Listening for VehicleSpeed on 0x{:03X} ...".format(ID_VEHICLE_DYNAMICS))
while True:
    while can.any(0):
        msg_id, ext, rtr, fmi, data = can.recv(0, timeout=0)  # 5-tuple on this build
        if msg_id == ID_VEHICLE_DYNAMICS:
            speed = (data[0] | (data[1] << 8)) * 0.01  # bytes 0-1 LE, 0.01 km/h
            over = "OVER {} km/h".format(SPEED_THRESHOLD) if speed >= SPEED_THRESHOLD else "under {} km/h".format(SPEED_THRESHOLD)
            print("VehicleSpeed = {:6.2f} km/h   [{}]".format(speed, over))
            if speed >= SPEED_THRESHOLD:
                led.on()
            else:
                led.off()
    time.sleep_ms(10)
- Press Run, open the Vehicle Dynamics popup, and drag the speed slider up and down. The LED on pin X1 lights as the speed crosses 30 km/h and goes out below it.
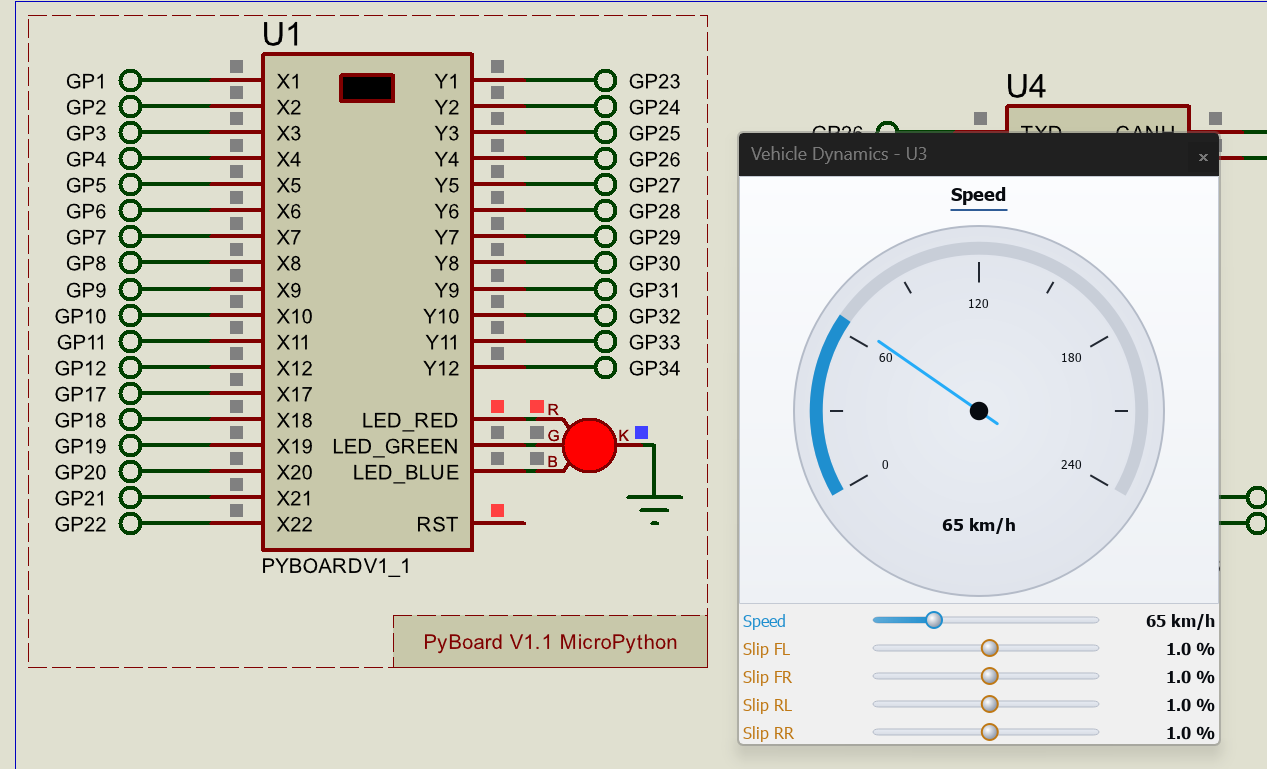
The running circuit with the Vehicle Dynamics speed slider raised and the pyboard LED lit.
Example 6: Inject a Bus Error
Deliberately corrupting a real bus is impractical in a teaching lab. In the simulation it is a menu click, and you can watch exactly how the protocol reacts.
- Open the sample design Can Analyser Showcase and press Run.
- On the analyser, select the Inject tab. This sample's nodes are all behavioural, so the Victim node list stays disabled and shows (no eligible nodes registered) – that is expected here, not a mistake; only a wired controller (an MCU's own CAN peripheral, or an MCP2515/MCP2518FD) registers as an injectable victim. Leave Error type at its default, BIT (TEC +8), pick a Target CAN ID from the drop-down (a live message such as 0x100), then click Inject.
- In the Frames tab, tick Errors only to bring the flagged frame to the top, then select it. The ribbon highlights the fault: a bit error ticks the corrupted bit, a CRC error shades the CRC field.
- Switch to the Monitor tab. With no eligible victim on this bus, none of the error counters move – that is the expected result of injecting by Target CAN ID alone on an all-behavioural design, not a sign the injection failed. The frame you flagged in step 3 is the visible evidence that it worked.
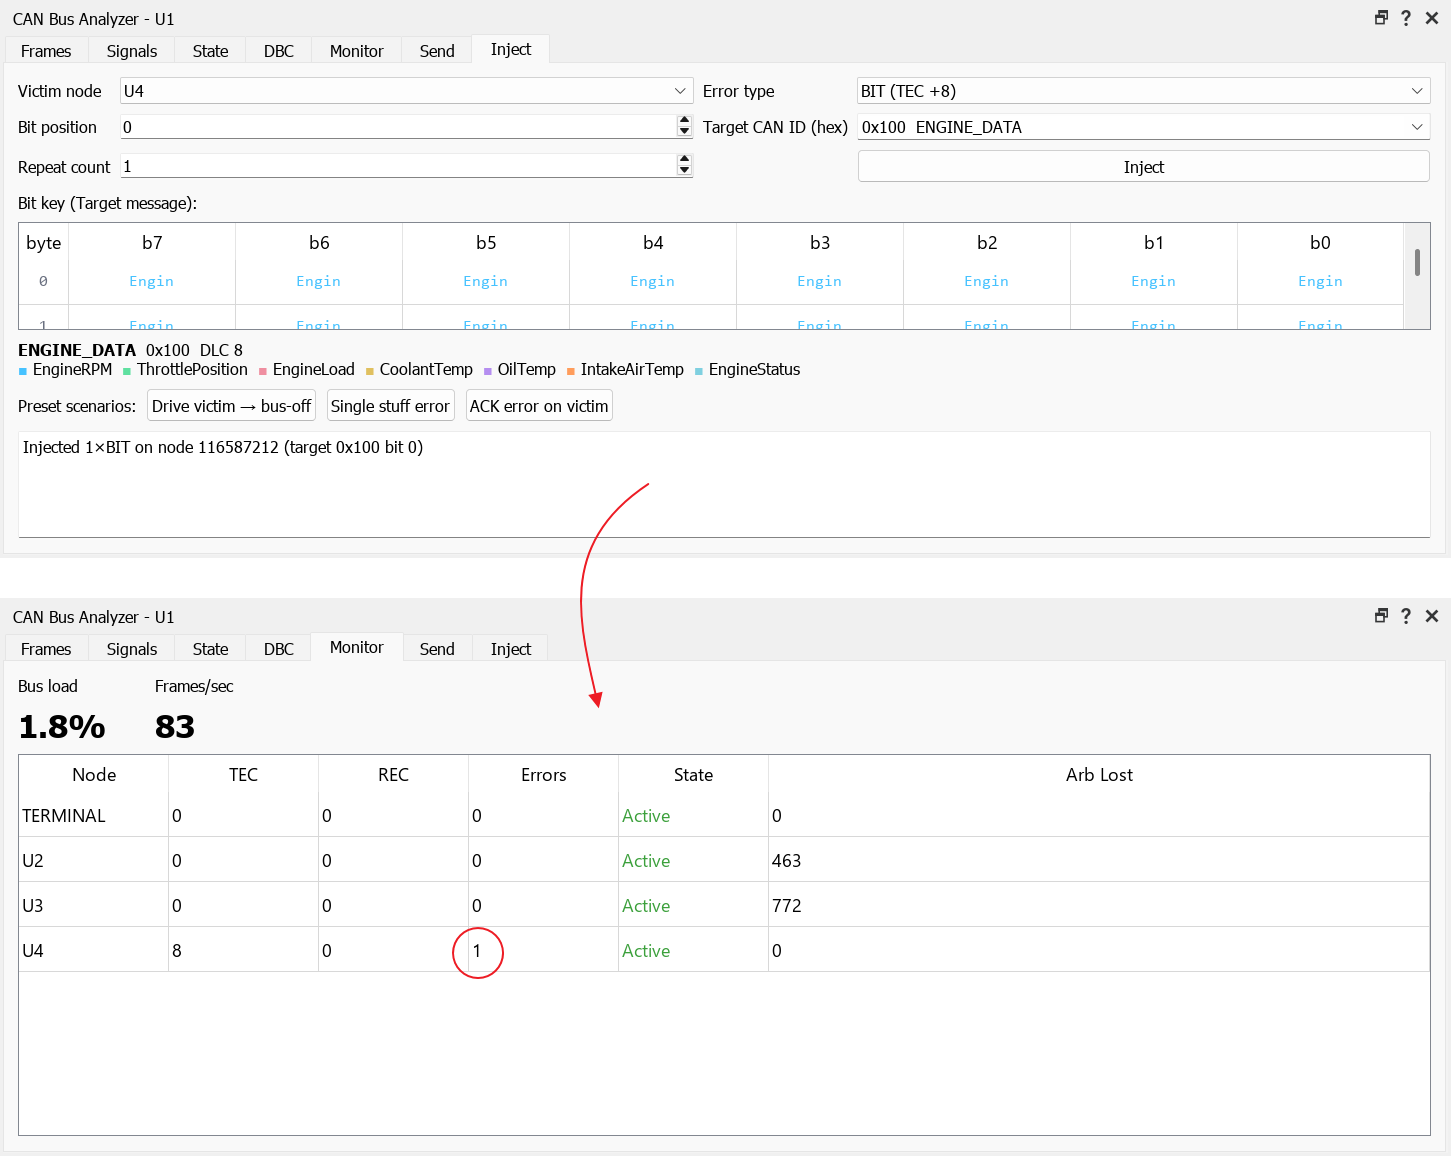
The Inject tab with an error injected and flagged in the Monitor tab.
To watch a node's error counters actually climb towards bus-off, the Victim node list needs at least one wired controller on the bus (an MCU's own CAN peripheral, or an MCP2515/MCP2518FD) – an all-behavioural design such as this one has no eligible victim, however you inject. Where a wired controller is present, select it as the Victim and use the “Drive victim to bus-off” preset, which applies 32 bit errors in one click. Pause the simulation first: this stops the error counter decaying between injections, and it also holds the resulting Bus-off state past its own automatic recovery (currently 5 simulated seconds), so the transition is clean, repeatable, and stays on screen for as long as you need it.
Example 7: Diagnose a Faulty Module
A node can be given a fault through its properties, so a student has to find it from the symptoms on the bus. This is the basis of a fault-finding exercise.
- Open the sample design lighting_body.
- Before running, edit the Rear Lighting Cluster's properties (see Setting Up a CAN Project) and set FAULT_MODULE to MUTE, so the cluster stops broadcasting its status, then close the dialogue.
- Press Run. On the analyser, note that REAR_LIGHT_STATUS (0x230) is now missing from the traffic, and the cluster popup shows its fault banner.
- Diagnose the fault: on the State tab the muted message's row is flagged SILENT, pinpointing which message has gone quiet and which node has stopped sending it.
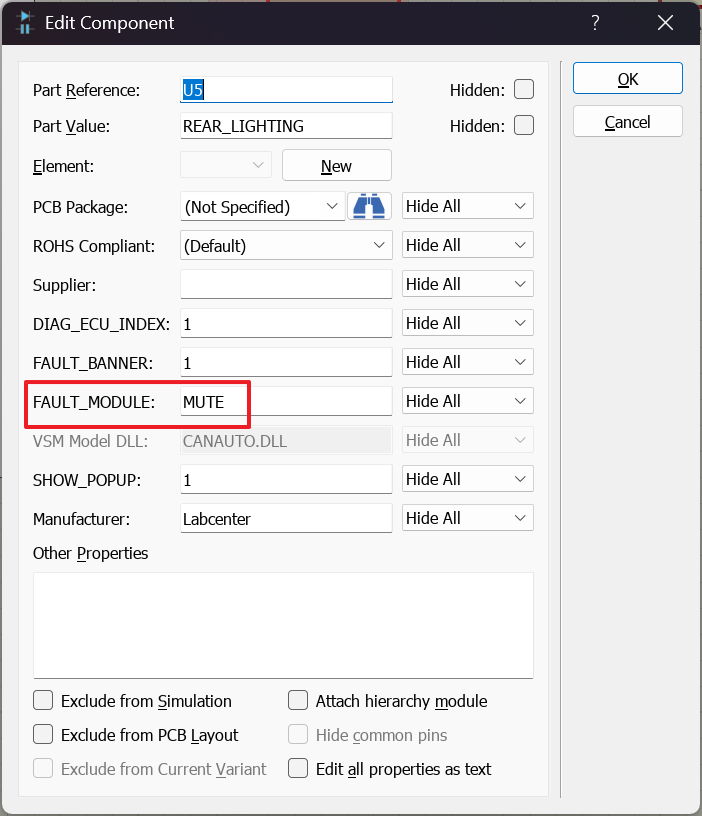
The Edit Component dialogue with FAULT_MODULE set to MUTE.
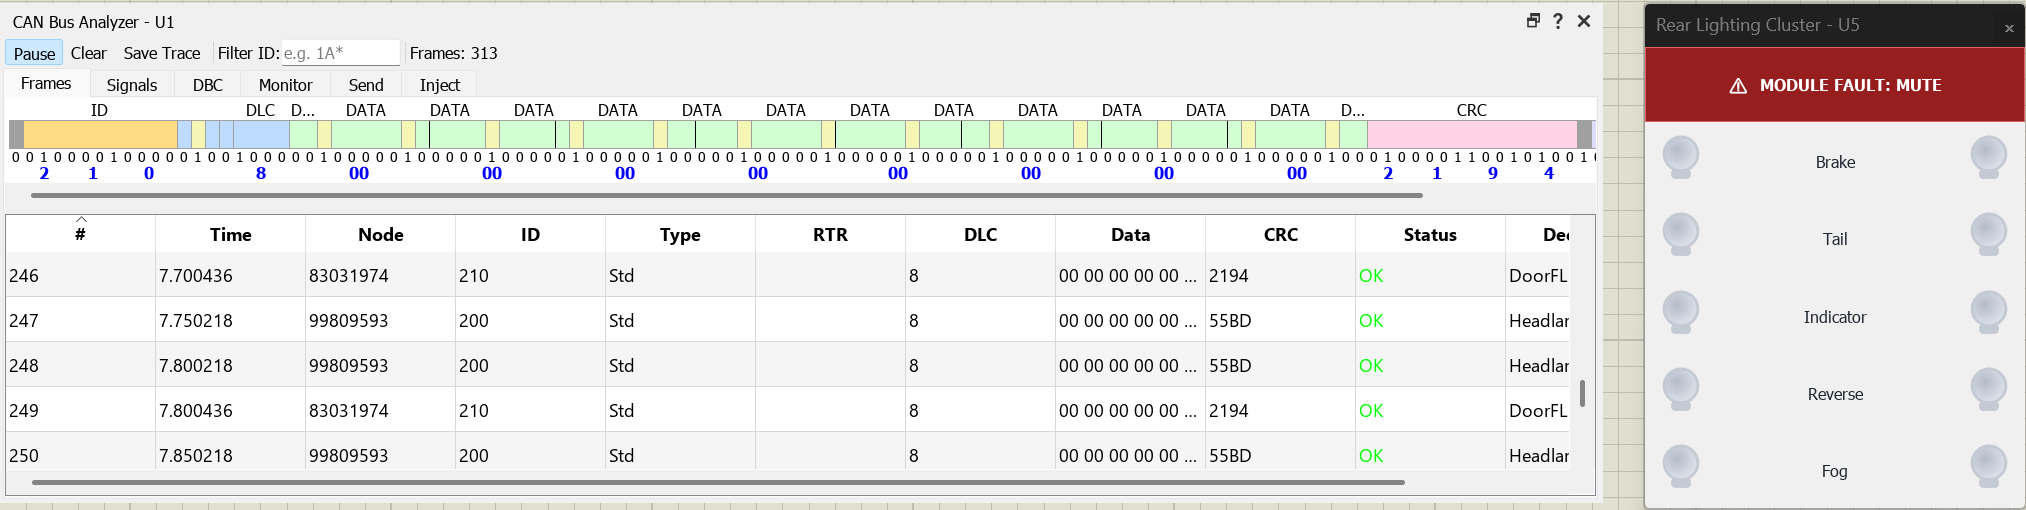
The analyser with the expected status message absent, and the faulted cluster popup showing its red banner.
Example 8: Read and Clear Trouble Codes with a Scan Tool
Faults also surface as stored diagnostic trouble codes (DTC) that a scan tool can read, exactly as in a workshop.
- Open the sample design Diagnostics and press Run.
- Induce a fault in a node popup: for example set the Coolant temp to be 140deg.
- On the Scan Tool popup, press the Read DTCs button. The stored trouble code for that fault appears, attributed to the ECU that raised it.
- Clear the fault in the node popup, then press Clear DTCs and Read DTCs again to confirm the code has gone.
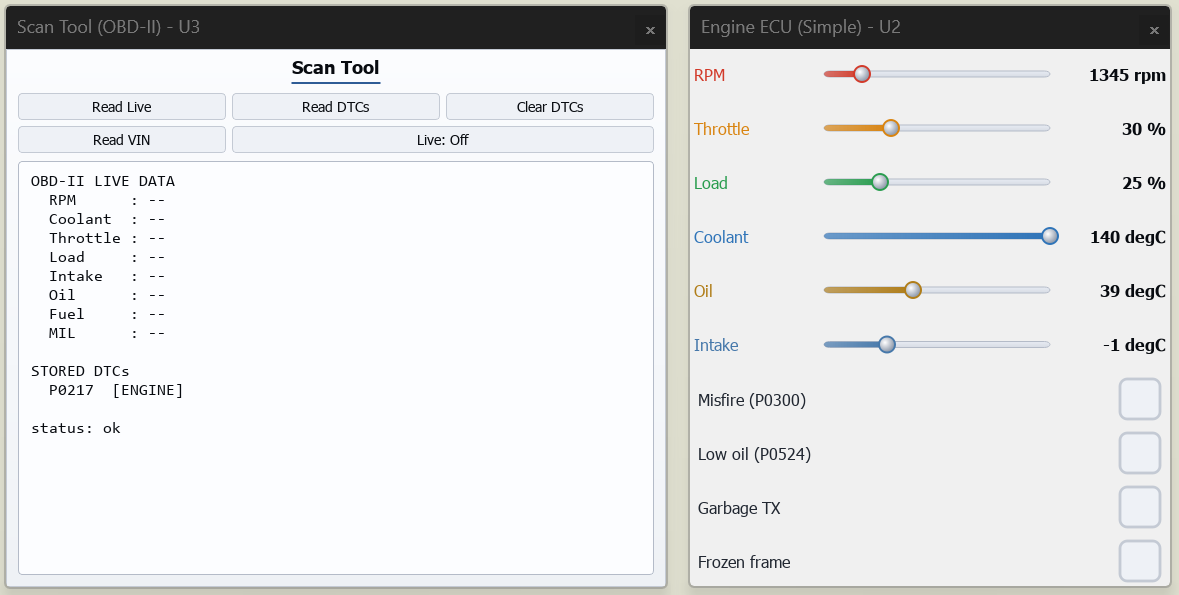
The Scan Tool popup listing a trouble code, beside the node popup showing the fault that caused it.
Example 9: Diagnose a Corrupted Safety Message
Safety-critical chassis messages protect themselves with a rolling counter and a checksum, and a receiver rejects a frame that fails them. This example corrupts the steering message and watches the stability controller refuse it. It is built from scratch.
- Build the standard circuit described in Setting Up a CAN Project, but instead of a microcontroller place three behavioural nodes on the bus: a VEHICLE_DYNAMICS node, a STEERING_SENSOR and an ABS_ESP node, with the analyser.
- Run, and confirm on the analyser that SAS_DATA (0x0C0) is flowing. Its counter field advances each frame and its checksum is valid.
- Edit the Steering Sensor's schematic part properties and set FAULT_MODULE to GARBLE so the frame is corrupted and its checksum no longer matches.
- Watch the ABS / ESP node detect the bad checksum, latch its plausibility fault and disable stability control. Read the resulting trouble code (C0045) on a scan tool.
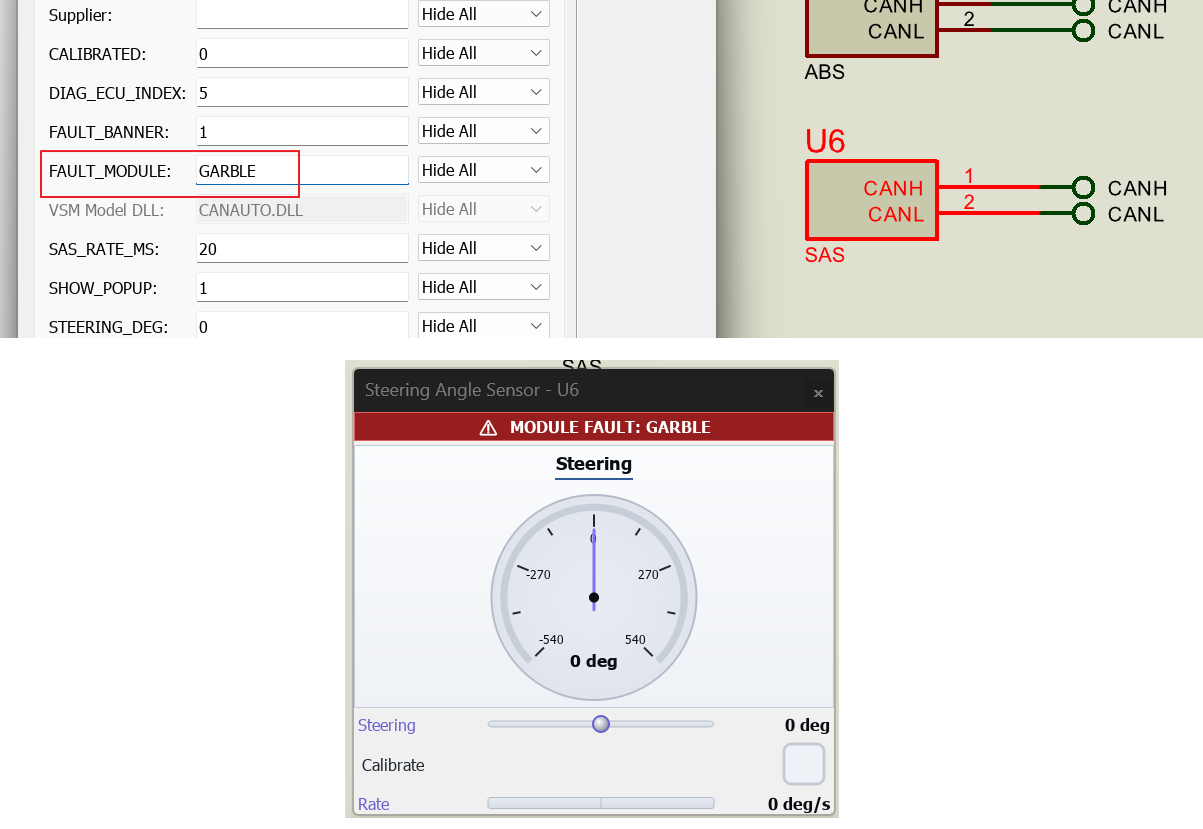
Setting the Fault Module and the Node showing the error
Example 10: Authenticate with the Immobiliser
An immobiliser only enables starting once a valid key has authenticated. This example shows a genuine key succeeding and a cloned key being rejected.
- Open the sample design Security Demo and press Run.
- In the Immobiliser popup, select Fob in range. The authentication sequence completes, the state moves to Unlocked and the start-enable lamp comes on. On the analyser, IMMO_STATUS (0x180) shows the rolling counter advance with each successful authentication.
- Select the cloned-key control and re-run the sequence: the same steps now fail, the state does not unlock, and start-enable stays off.
- For the workshop route, use the analyser's Send tab to run the UDS SecurityAccess seed-and-key exchange by hand against the same node (this design has no scan tool): send 27 01 to request the seed, read the seed from the reply, then send 27 02 <key>. The exchange, its worked figures and its deliberate weakness are described in CAN Security.
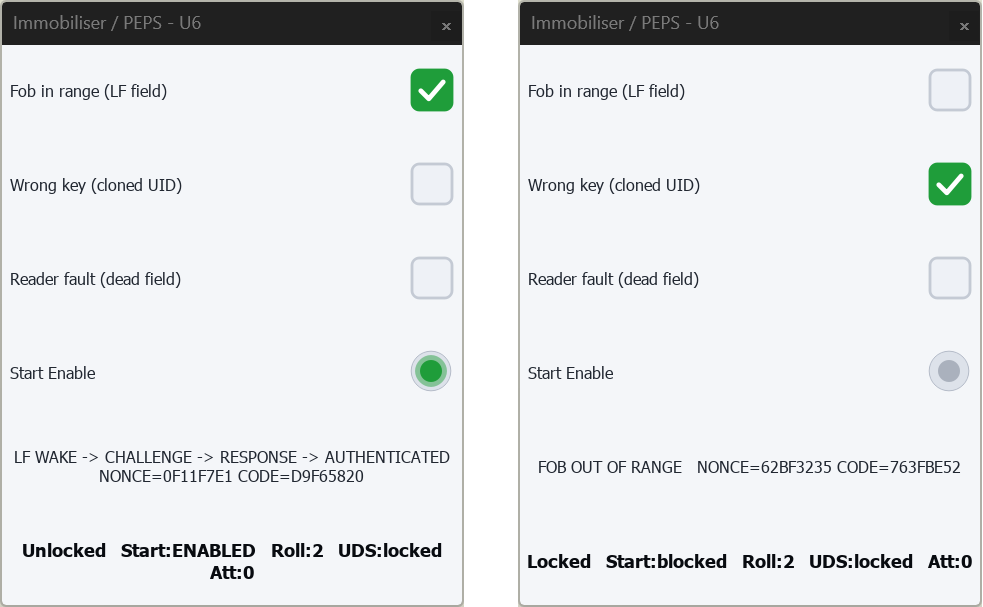
The Immobiliser popup with a genuine key authenticated and start-enable lit, and the same popup rejecting a cloned key.
Example 11: Read a Multiplexed Message
A multiplexed message packs several unrelated sets of signals into one identifier, with a selector byte saying which set the frame currently carries. This example reads one by hand.
- Open the sample design Diagnostics and press Run.
- On the analyser, find the single message on 0x300. Open its bit ribbon and note that the first byte is the page selector and that the other bytes change meaning as it steps.
- In the Diagnostic Multiplex popup, hold the page fixed on one selection and confirm the bytes settle to that page's signals; then let it cycle and watch them change page by page.
- Because the analyser has no built-in multiplexor concept, decode each page from the raw bytes using the selector, exactly as you would when a database does not describe the multiplexing.
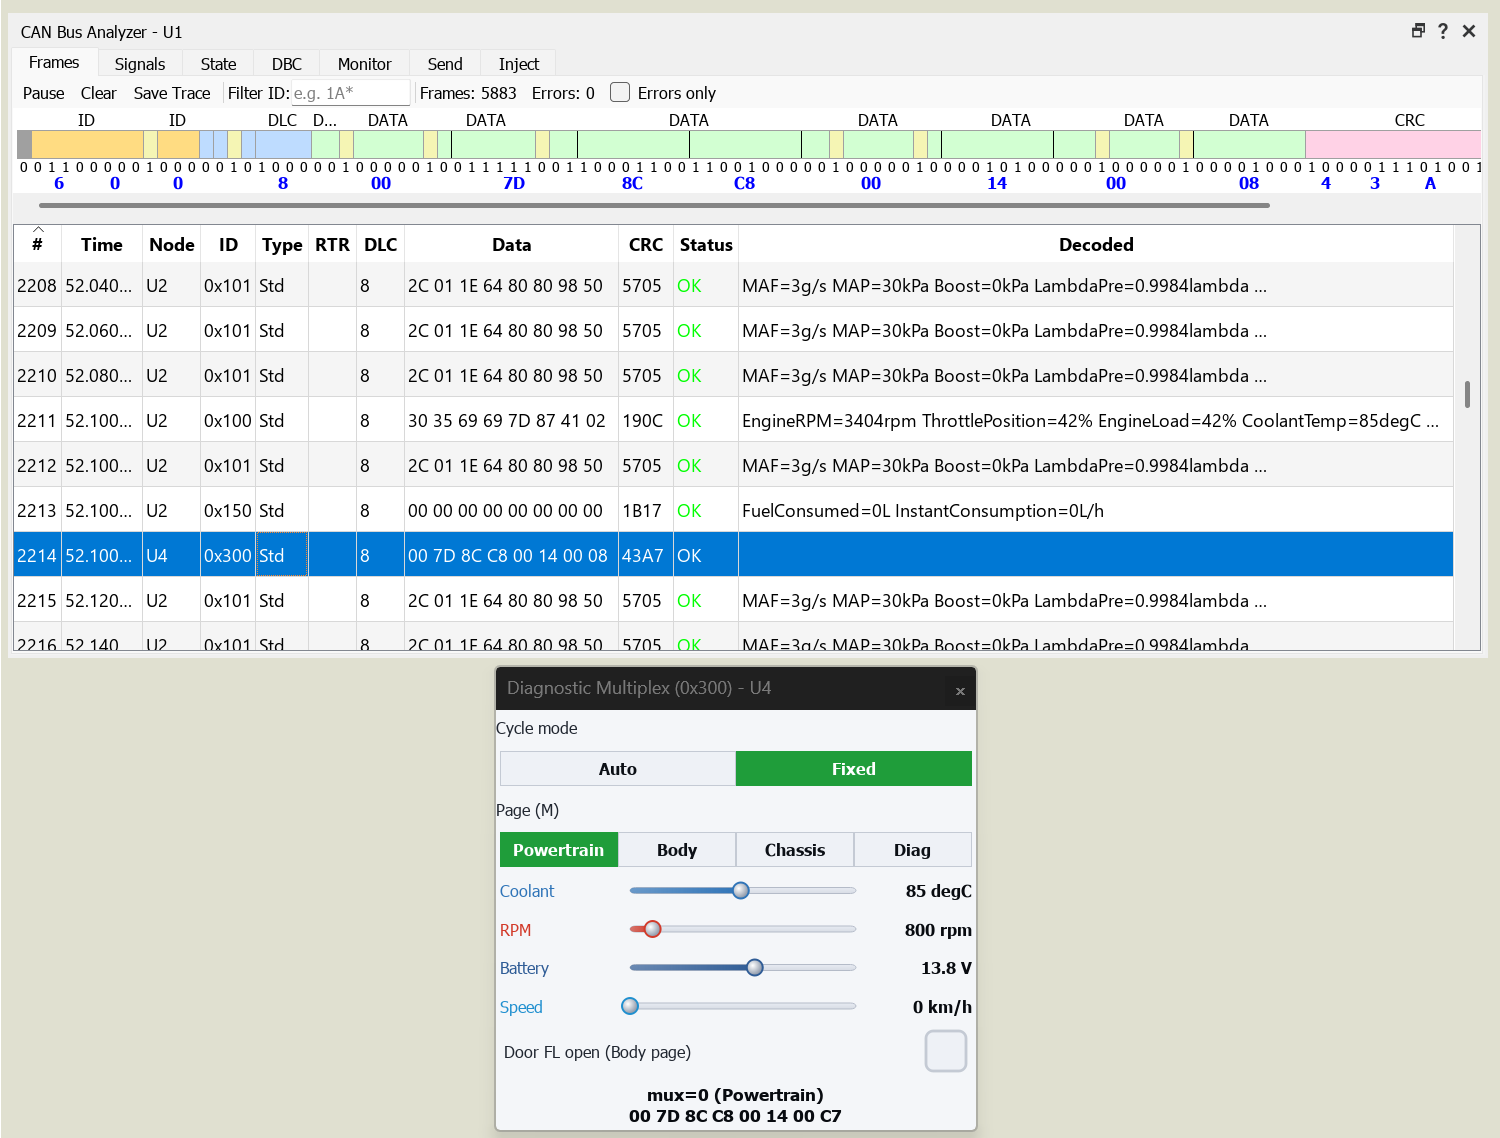
The analyser bit ribbon of the 0x300 frame with the selector byte highlighted, and the multiplex popup holding one page.
Example 12: Detect an Attack on the Bus
The security nodes turn the bus into an attack-and-detect bench. This example mounts an attack and catches it with an intrusion detector.
- Build the standard circuit described in Setting Up a CAN Project, placing a genuine source such as an ENGINE_ECU, an ATTACKER and an IDS_NODE on the bus, with the analyser.
- Run: the detector shows green MONITORING.
- Stop the simulation and edit the IDS_NODE schematic part and set VALID_IDS to the identifiers the bus legitimately uses (for example 0x100, 0x110, 0x130).
- Press Play: In the Attacker popup, select Flood, then Spoof on an identifier outside the allow-list. Each trips the detector: the popup turns red and names the rule, and an IDS_ALERT frame (0x250) appears on the analyser.
- Read the stored security trouble codes on a scan tool, then explore the defences (authenticated messaging and access control) described in CAN Security.
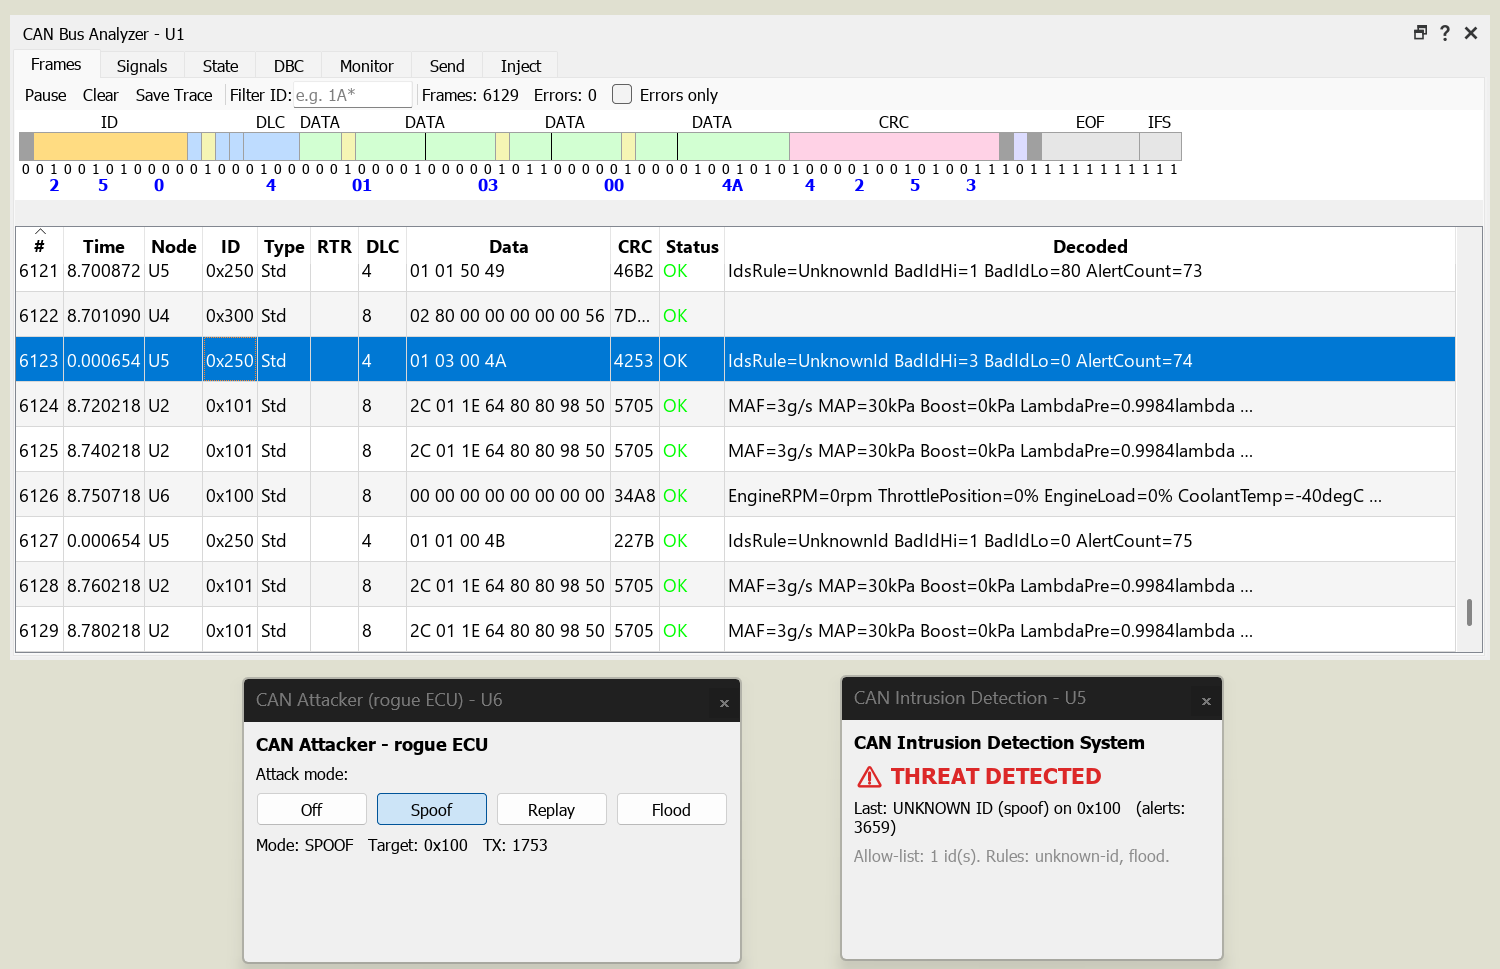
The Intrusion Detection popup showing THREAT DETECTED during an attack, beside the analyser with the IDS_ALERT frame on 0x250.
See Also