TUTORIAL 2 : LOGGING THERMOMETER
Introduction
In this tutorial we will be setting up a logging thermometer application. Our front panel will consist of a graph with some buttons to adjust the range of the display and a thermometer to show the current temperature. On the hardware side we'll use the Arduino Yun and a grove temperature sensor.
While relatively simple with IoT builder, this is still a bit more involved than our blinking LED tutorial. To avoid information overload we won't go over the same basic techniques that we covered in the first tutorial so it is worth either working through that one first or at least referring to it where needed.
See Also:
Front Panel Design
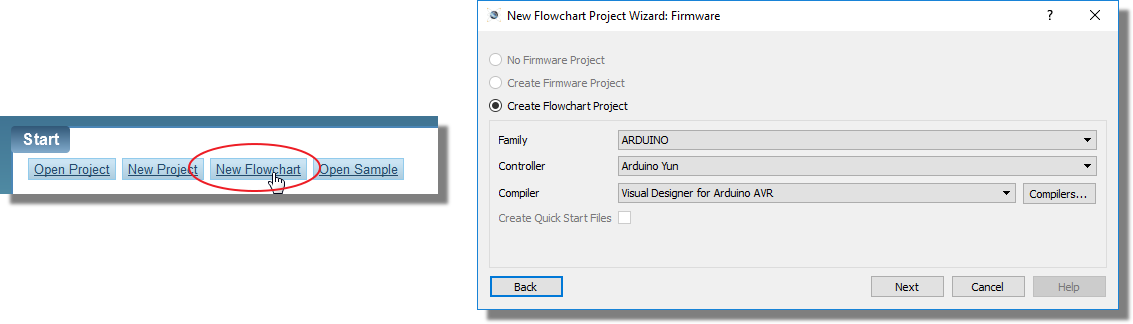
First, we'll create a new project with Arduino Yun and Visual Designer. This means that we will be designing our program with flowchart blocks.
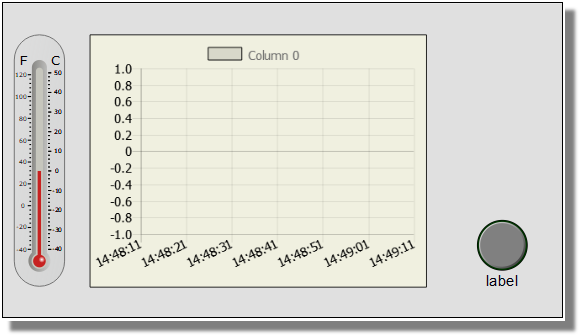
Our front panel for the logging thermometer is going to look like the screenshot below.
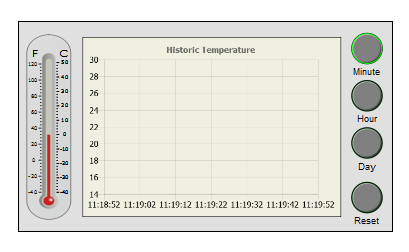
Front Panel concept for a logging thermometer application
Control Picking
All of the constituent parts are added from the IoT controls library which we access either from the Project Menu or by right clicking on the Arduino Yun in the Project Tree.
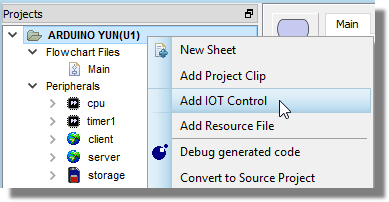
We want a mercury thermometer (-40 to 50 Celsius should be fine !) which can be found in the Display Controls category, a line chart with time x-axis which is under the chart controls category and then we need four buttons from the buttons category.
The buttons are worth further discussion because what we actually want is a group of buttons, much like radio buttons, that correspond to minute, hour and day. These are mutually exclusive - there will only be one selected at a given time - and so we can add them as a button group. To this, select radio buttons (round) and then change the number of elements to three at the bottom before adding to the project.
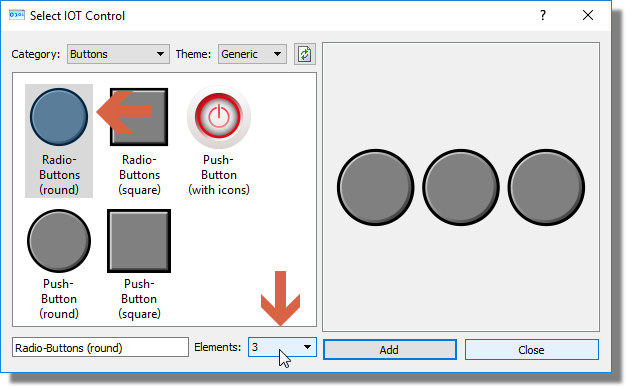
The reset button by contrast is a normal, stand-alone button so we can select push-button and add in the usual way.
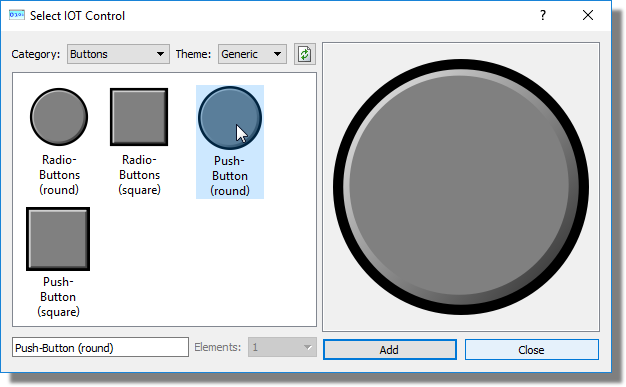
In the screenshot above and in our selections we've chosen to add everything in the basic (generic) theme. You can of course change the theme from the top right and style your front panel in a different way if you like.
Control Placement
Now that we've added everything we need into our project the next step is to lay out the controls on the panel itself. Your project tree should look something like the following.
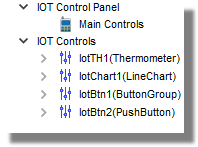
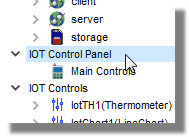
Double click on the IoT Control Panel to open it in the Editor.
Remember that it is best if you first configure the panel size according to your target (iphone, nexus, galaxy, etc.) before you start placing controls. This is covered in the first tutorial. The default panel size is fairly standard for a modern mobile phone in landscape mode.
Drag and drop the thermometer onto the panel and position on the left hand side.
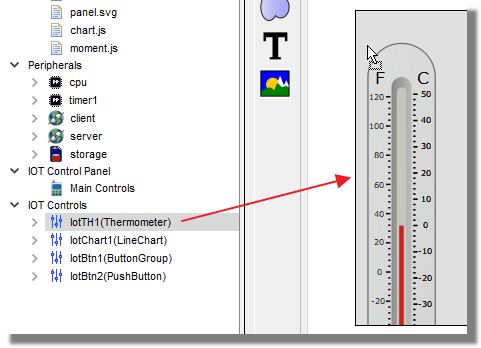
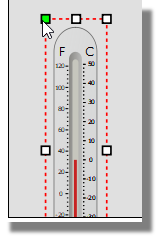
You might find that it is too big for the panel by default in which case simply use the drag handles to resize and then pick it up and re-position as required.
Repeat with the line chart and the reset button.
Now place the button group loosely on the panel - over the middle of the line chart is fine.
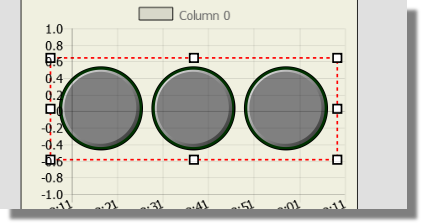
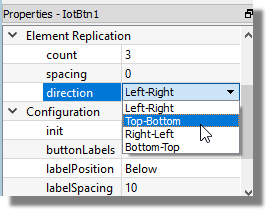
Switch to the property pane and find the element replication properties. Change the property direction from left-right to top-bottom.
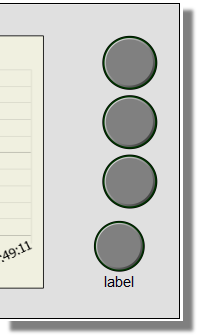
Now resize the button group to fit and then re-position above the reset button.
Properties and Alignment
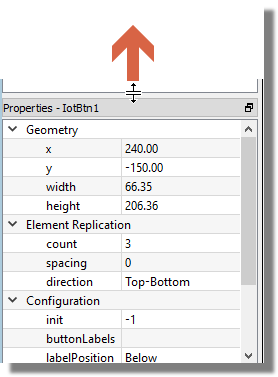
Unless you are very good at this, it's likely that your buttons are looking pretty ugly at this point. They may well be 'squashed' in one dimension and the button group is probably not exactly the same size as the reset button. That's to be expected at this stage and we'll adjust the sizing and placement as we add labels in the property pane. Select the button group first and then drag up the property pane so we more easily make changes.
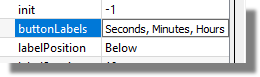
Scroll down to the configuration section and enter the labels as a comma separated list beside the buttonLabels property.
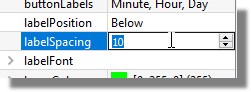
We'll need to include a little bit of label spacing (between the button and the text) so set this to 10
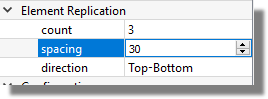
Next, we need to set the separation between the buttons so look for the spacing property under element replication and set this to 30. This is the distance from bottom of one button to top of the next button.
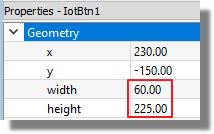
The size of the buttons needs some adjustment, you can resize them by dragging one of the corner nodes, or you can set the size manually. In this case we will set them to be width 60 and the height (of all three buttons) to be 225.
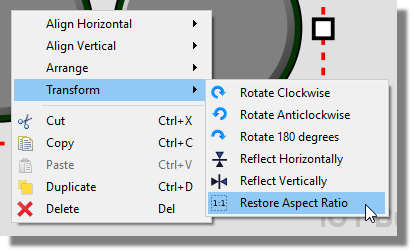
Note that if you have the buttons out of shape, you can right click on the buttons > Transform > Restore Aspect Ration
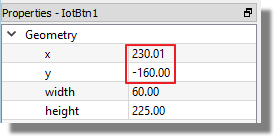
We need to move the button group into position manually or by adjusting the x and y values in the geometry section.
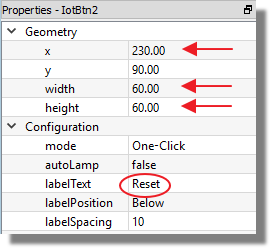
Now, switch to our reset button, set the label to be Reset, the width and height to be 60 and the x-value to be the same as the button group in order to align.
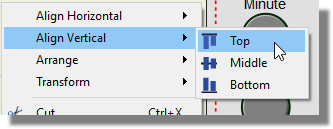
You can align multiple objects by holding the CTRL key and clicking on the objects, then right click > Align Hoz or Align Vert.
We could continue to align the line chart and the thermometer in a similar way. For example, if we set them all to have the same y-value (e.g. -165) the top of all the elements will be perfectly aligned.
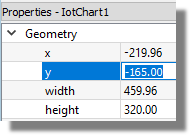
Chart Configuration
The line chart is a very flexible control and has several configuration options. In our case, we will changing many of these at run time (for example, we will be changing the time axis as the user presses a button to adjust the historic range). However, there are a few aesthetic things we can set up now. As normal, this is done via the property page once the control has been selected.
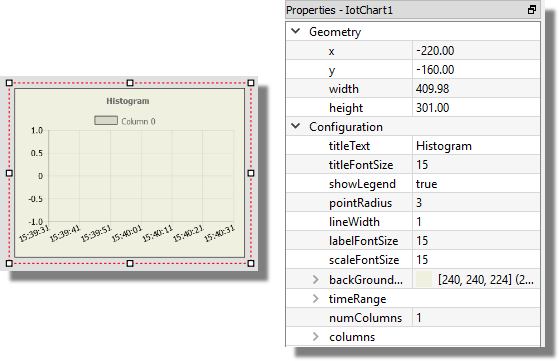
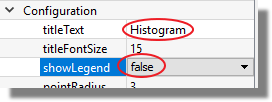
We can start by giving the chart a title and, since there will be but one dataset, we can remove the legend.
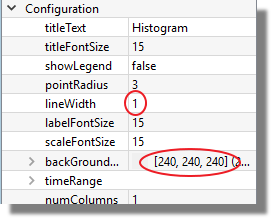
The line width can be dropped down to single pixel and we can change the default background colour to something more complementary to our panel.
Writing the Firmware (Flowchart)
Now that we have our front panel in reasonable shape it's time to think about our program.
We will skim quite quickly over the basics of flowchart design in this section. Please refer back to the Visual Designer help file (accessible via the Help menu in Visual Designer) if you need more detailed coverage of anything.
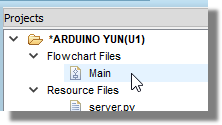
Switch to the flowchart by double clicking on the main flowchart file in the project menu.
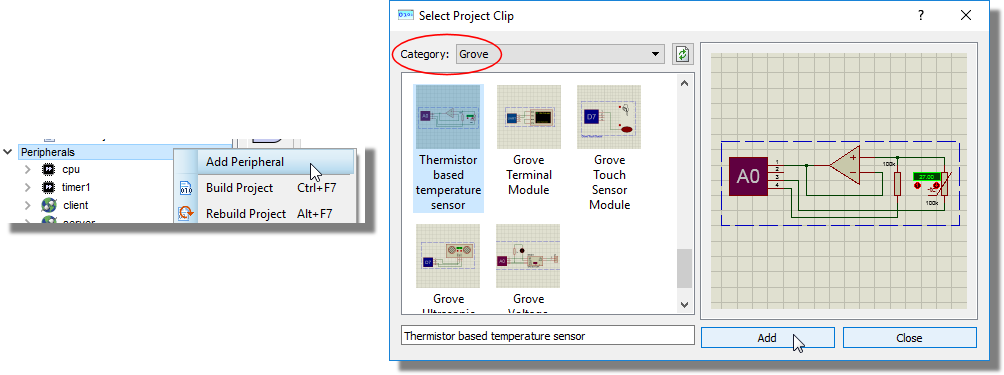
We need first of all to add the temperature sensor to our schematic (virtual hardware). We do this in the usual way via the Add Peripheral command in the project menu and add in the grove temperature sensor.
Program Structure
Broadly speaking, our program is going to need both a setup phase and an operating phase and it is going to have to respond to user input in the form of a button press. The button press can either be a change in the history range for the chart (a press on one of the button group) or it can be a press of the reset button. We already have flowchart constructs for the setup phase (setup) and the operating phase (loop). We can respond to a button press with an event in the flowchart and, as we've seen in the first tutorial, we can add this simply by dragging and dropping from the IoT Control in the project tree onto the flowchart.
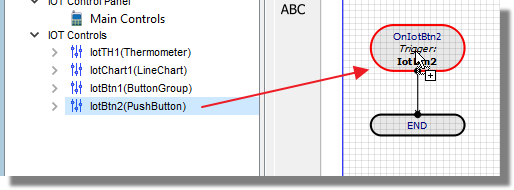
We need to do this both for the button group and for the individual (reset) button. With a little movement of chart elements around our basic program structure should now look like the following.
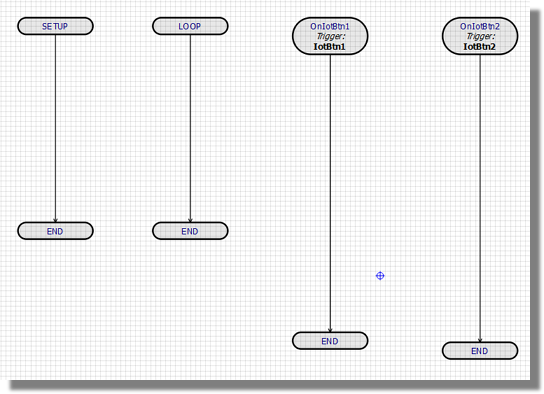
Basic routines for our program
It's a good idea to edit and change the names of the two button handlers to something more readable. For example, we can change to 'onbuttonGroup' and 'onResetButton'

Setup
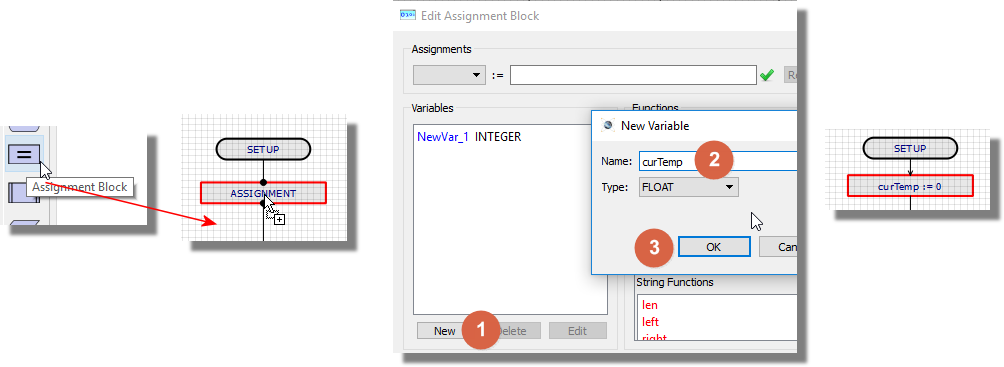
The setup routine is where we do any initialization tasks before the program begins running properly. Since we have a thermometer that will be showing the current temperature we will need a variable into which we will store the temperature. Drag an assignment block onto the setup routine, edit and create a new variable for curTemp. Assign the variable to zero and as type FLOAT here.
We also need to store our historical temperature data. For small data sets this can be done automatically and will store as session data on the Atheros but for larger data sets you can specify a filename and the data will then be stored to file, either on the Atheros or on the SD Card. We specify a data file for logging by expanding the methods of the chart IoT Control and then dragging and dropping the setDataFile method onto the flowchart.
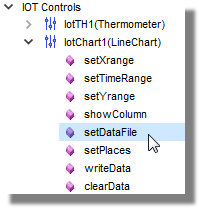
The log file for chart data points is by default stored in the VSM folder on the Atheros (Linux) chip on the Yun. You can mount it on an SD card by prefixing the file name with a path (e.g. /MMT/SDA1 for Yun shield or /MMT/SDB1 for Yun)
Edit the flowchart block and specify the filename.
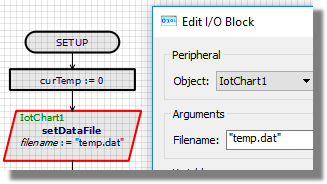
The other thing we need to do before we start logging is to make sure that the timeserver is up and running. We can do this by expanding the server peripheral and then using drag and drop in the normal way to position on the flowchart. This method takes no parameters as it is essentially a smart delay and will exit when the server tells it that the timeserver is active.
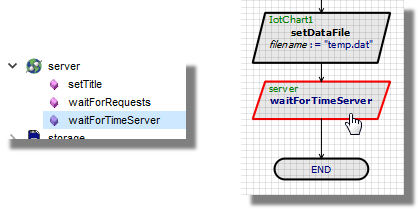
The timeserver is part of the Linux OS running on the Atheros which queries the current time from an internet server.
The waitForTimeServer() method ensures that the time server is running and that we are receiving valid time points before it returns. This means that if your physical Yun is not connected to the internet (i.e. not receiving valid time) then this command will never exit and your program will not work.
Your setup routine should now look something like the following
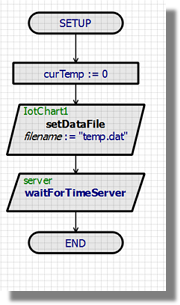
Setup routine for the logging thermometer.
Loop
Now that we have the initialization out of the way we need to think about what our running program is actually going to do. We need to do three things in normal operation:
- Read the temperature
- Update the thermometer
- Write the chart data
- Check if the temperature has changed
The first of these is the easiest. Our thermometer is working in Celcius so we can simply drag and drop the readCelcius method from the grove temperature sensor into the top of the loop routine.
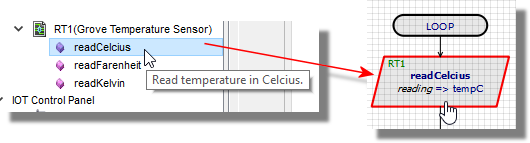
Farenheit or Celcius is a configurable parameter in the property panel in the IoT Builder for the Thermometer. We could easily switch the thermometer into Farenheit and then use the corresponding method on the grove temp sensor to read the value.
Note that a new float variable (tempC) is automatically created and assigned to reading it.
The reason we don't assign directly to the curTemp variable is time. Our loop routine is going to execute extremely fast which means if we don't think about what we are doing three things will happen.
1) Our log file will become enormous very quickly.
2) We'll be sending huge amounts of unnecessary traffic back to the controller front panel.
3) We'll be unresponsive to UI commands from the GUI because we are executing a tight loop at full speed.
So, when do we need to update the front panel ? Clearly, when the temperature changes we want an update so we'll add a test for temperature change. We can therefore add a decision to the chart that checks whether the temperature difference is greater than half a degree since our last logged temperature.
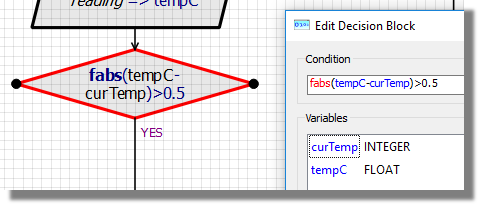
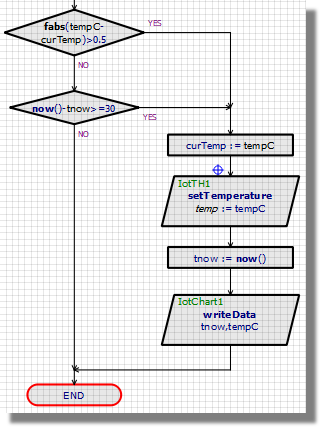
If the temperature has changed we need to assign the temperature reading (tempC) to our temperature variable (curTemp) in order that our test is valid the next time we execute the loop routine. Drag an assignment block next to the fabs decision block and set the following:
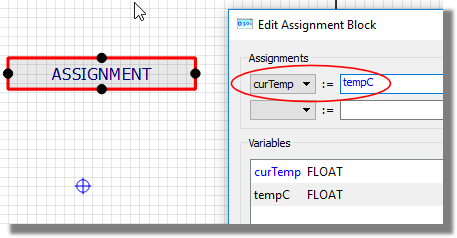
Next, we need to update the thermometer on the front panel with the temperature. We can do this by drag and drop of the setTemperature method of the thermometer IoT Control

Finally, we need to log the temperature change. In order to do this we need to know the current time, otherwise we can't log a data point properly. We can get the time via the now() method and store it into a new variable (tnow) using a standard assignment block.
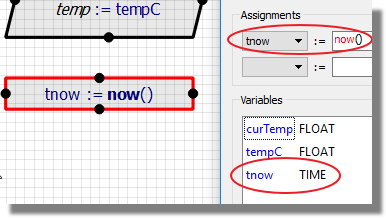
The now() method is simply a Visual Designer call on the timeserver that returns the time in secs since the EPOC in local time. It therefore enables the AVR side not to worry about time.
Now we can use the writeData method of the IoT Chart control to log the data point.
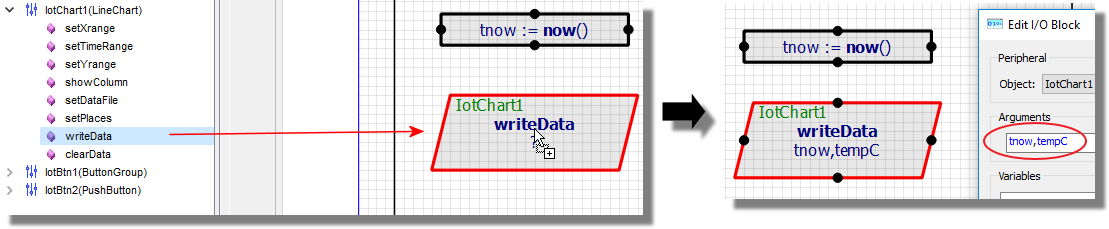
The writeData() method will both log the data point to file and update the chart with the current data point.
Now, if the temperature doesn't change we'll still want to log data points periodically. Let's say we write every 30 seconds or so if the temperature stays the same. We can do this by adding a simple test to the 'no' branch of our temperature check test. (again you will need to swap the yes/no.)
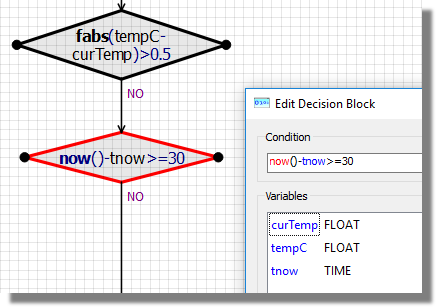
Connect up to the 'action branch', if the result of our time test is positive so that we log if 30 seconds or more has passed since our last log. This is what you should have so far:
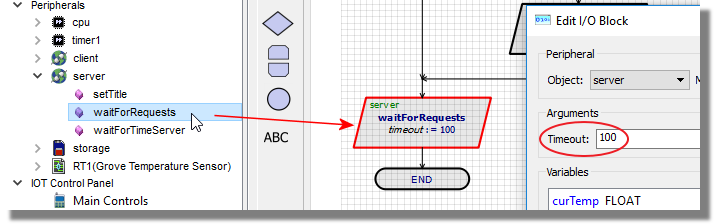
The last thing we need to do is add a pause. This will slow down the execution of the loop routine and allow time for pending UI commands such as a button press to trigger. It is extremely important here that we add a WaitforRequests server method rather than a normal delay method. A delay method is blocking and button presses etc will not be processed while we are in a delay routine. By contrast a waitForRequests routine will yield to an interrupt such as a button press. To address problem (3) above and keep an IoT application responsive to the GUI therefore you should always use waitForRequests as shown below.
Your loop routine should now look something like the following.
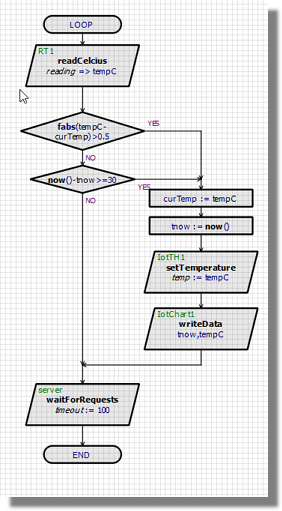
Main execution loop for the logging thermometer.
Not considering execution time versus update time to the controller is a very common mistake with this kind of program. Always remember that the loop routine will execute very quickly and anything you log/display/store is not going to work nearly as fast.
Button Group Event
We've now got our program logic set up so the next question is how do we respond to a UI request from the controller. If we first consider the button group then we know that we'll be arriving at the top of our onButtonGroup() routine whenever a button in the group is pressed. So, we need to first determine which button it is and then set the chart x-axis to span one minute, one hour or one day.
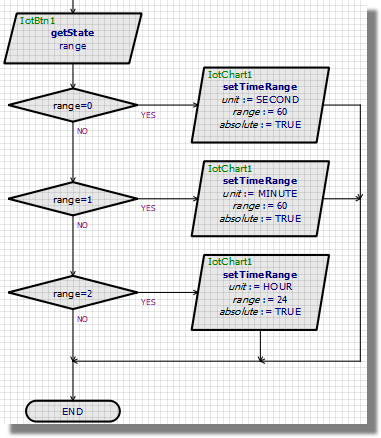
Start by dragging and dropping the getState method from the button group IoT control. Add an integer variable called 'range' and assign the result to it.
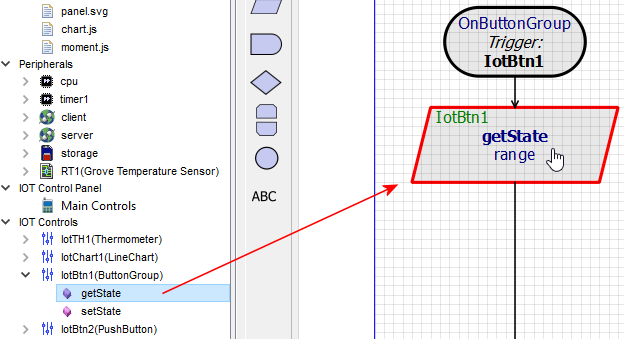
GetState() on a button group returns a zero based index according to the buttons position in the group. The first button is index 0 (Seconds in our case), the second is 1 (Minute) and the third is 2 (Hour). It is set up this way so that a button group can be extended as much or as little as the user requires. For example, you can specify a 10 button group and then test between 0 and 9 to determine which button has been pressed.
Now we have the state we need a test for each button state and we need to set the x-axis range accordingly in each case. So, in the case of the seconds button we want to test for range=0. drag a decision block on to the flowchart and add range=0 having swapped the Yes/No.
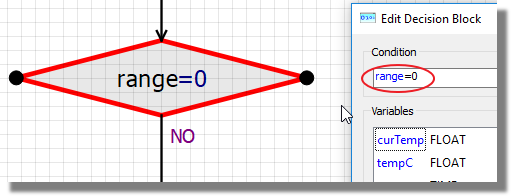
To set the x-axis to span one minute we are specifying a time range so drag and drop the setTimeRange() method from the line chart IoT Control.
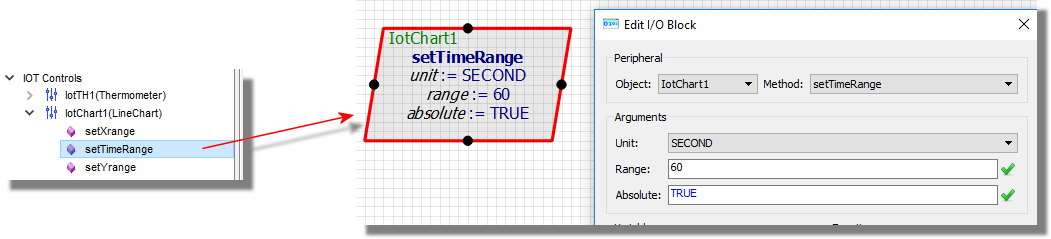
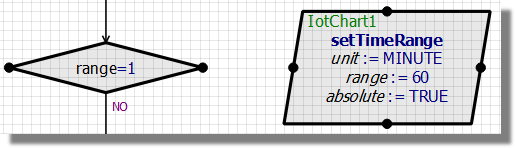
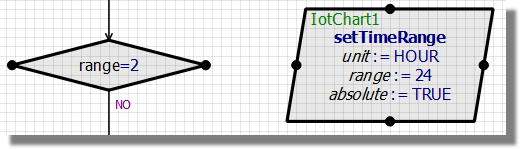
The configuration is then to set the units to seconds and the range to 60 (60 secs = 1 minute). We also want the range to be absolute as above. The time range specifies the amount of time displayed, going backwards from the latest timepoint in the data.
If Absolute=FALSE then the time data is relative.
Now, we rinse and repeat with our test for the minute button press.
And finally for the hour range test.
The button group handler should look something like the following when you are finished.
Reset Button Event
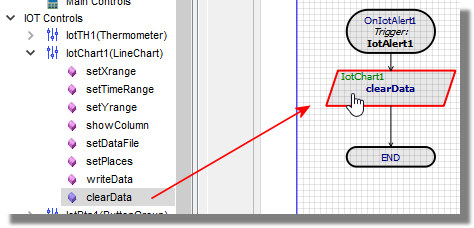
Our last job is to respond to a reset button push inside the onResetButton() routine again, the IoT control for the line chart has the method we need so all we need do is drag and drop the clearData method into the button handler.
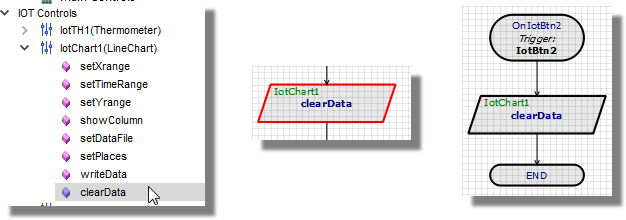
Simple method for handling the reset event.
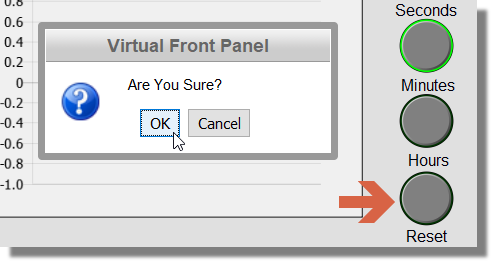
Since we are wiping the entire graph history at this point it may be better to prompt the user to confirm the action before we do this. Fortunately, IOT Builder can provide a way to do this by using the AlertBox control. To use this control, first pick it from the text area of the IoT controls dialogue
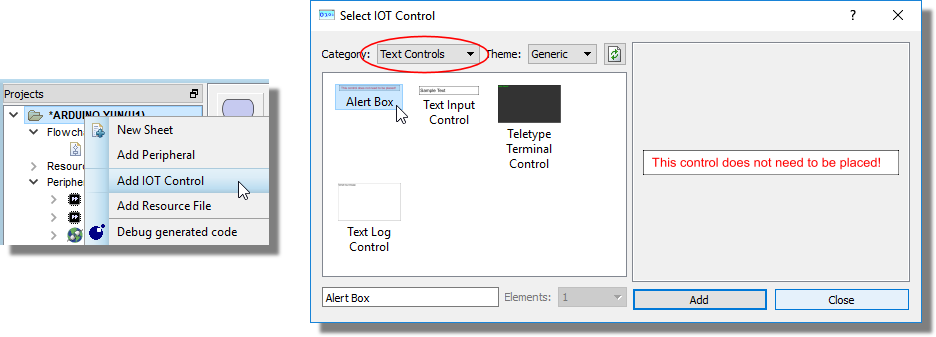
Unlike other controls this one doesn't need to be placed on the panel. We can switch directly to the flowchart and drag the Alert control on to the flowchart and move to a required location:
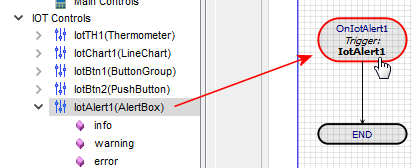
Now drag the 'confirm' method onto the reset button event handler.
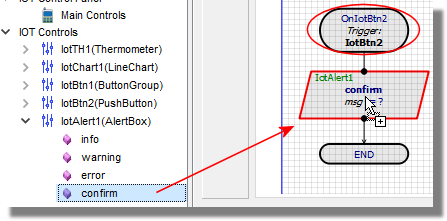
Edit this and provide suitable text for the message.
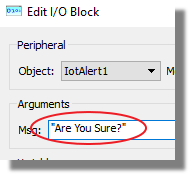
What we want to do here is clear the data because the user has confirmed that this is the action they want.
Notes:
An alert box is a two stage process. First you have an alert method which pops up the box for user input. Second you have an alertbox handler which is called if the user presses the OK button.
The alertbox handler is called when user presses the OK button only !! The text of the alertbox is irrelevant - if the user hits OK the event handler will be called and if they don't it won't be called.
Certain types of alertbox (e.g. info) only have an OK button and so the event handler will always be called. Others, such as confirm, give the user a cancel option. Note that, even in the case of the confirm box you are not giving the user a binary choice because you cannot respond directly to a cancel in your program - the alertbox handler is called only when the OK button is pressed.
The call to the alert box handler returns immediately and program execution continues ! You need to therefore consider what code will be executing while the user is reading the message and responding.
Summary
That's everything we need for a IoT enabled logging thermometer in a single sheet of flowchart program. There are some important principles and tips from this process that will apply to almost all of your own projects which are summarized below.
- Your front panel actions (switches, buttons, sliders, etc.) are processed in the flowchart as event routines. Drag and drop from the IoT Control onto the flowchart to place the event routine and then add the required blocks inside it.
- Think about time when it comes to your loop routine. How quickly will it execute, how quickly does it need to execute and is there time to respond to GUI commands.
- Always use waitForRequests() instead of a normal delay() if you want your program to respond to UI events.
- If you are in doubt about how to drive a peripheral on the schematic look at it's methods in the peripherals section of the project tree.
- If you are in doubt about how to do something with an IoT control look at it's methods in the IoT controls section of the project tree.
Simulation
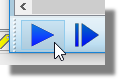
Now that we've worked through the front panel design and the programming we can give the entire system a trial and see how it works. Start by pressing the play button to run the simulation.
You should end up with the front panel in the main section of the window with the reset button on the Yun at the top and our temperature sensor at the bottom. You can resize these windows as required - in our case it would make sense to make the temp sensor larger so that we can see the readout.
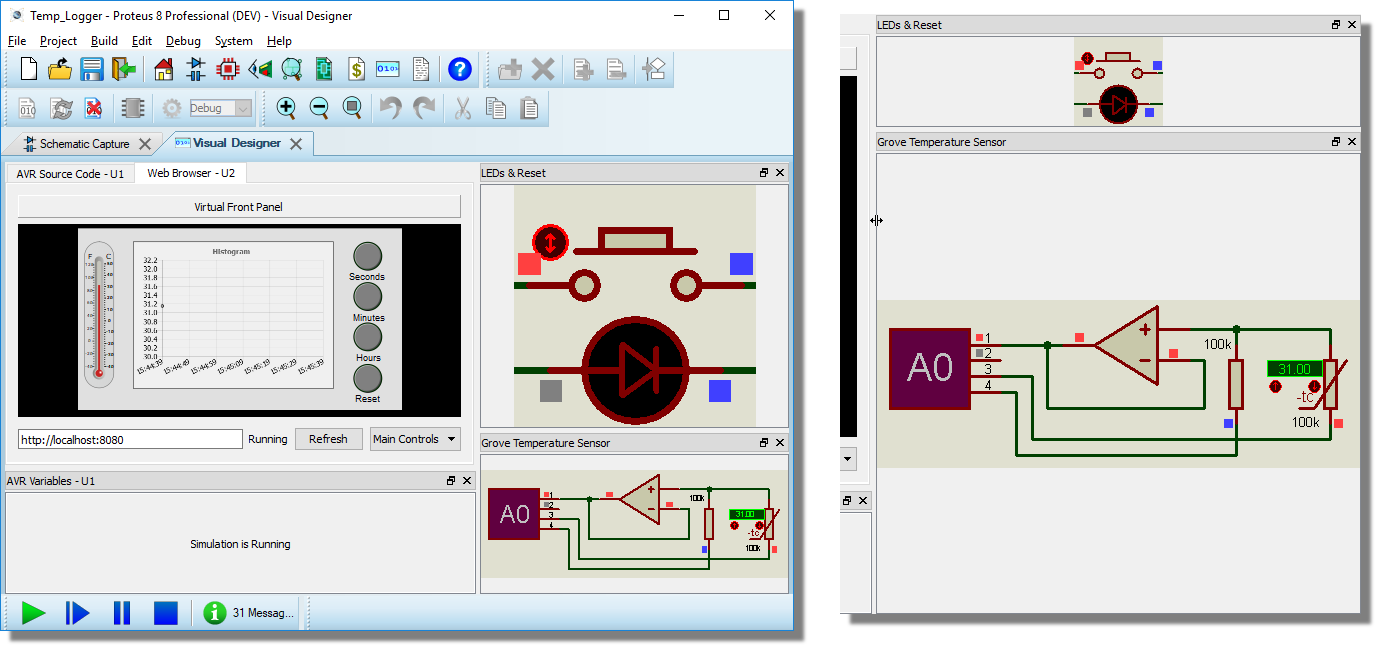
You should notice that the time period on the x-axis matches the default in the button group and that it actually showing the correct time.

You should also notice that the graph time range advances every minute in real time.
Our first test is to increase the temperature on the temperature sensor by clicking on the activation button and check whether the live display on the thermometer and our chart responds accordingly.
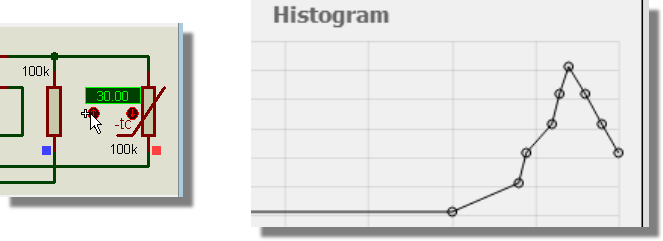
Similarly, we can reduce the temperature on the temp sensor and check our display. We can hold the mouse on the down button to move the temperature down rapidly and examine how responsive our chart and thermometer are.
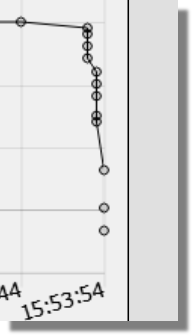
Compare how easy it is to bounds test a temp sensor compared to the real world (hair dryer and fridge ?).
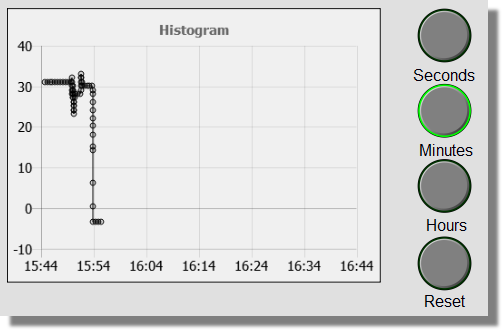
After a minute or so our data changes will be moving off the chart so we can change the range to one hour and check that the time range is correct and that the data from our temperature testing has been correctly stored.
Finally, we can reset the display and confirm that our data set is wiped by checking the chart display.
If you want to at this stage you can also check how the front panel looks and performs from your mobile/tablet device. This is discussed in the first tutorial here.
Debug
Let's look at a few different ways we can pause our program and single step to look closer at our program flow if something has gone wrong. Press the pause button to halt the running simulation and switch to the source code tab.
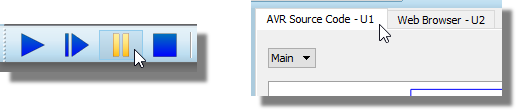
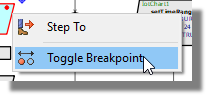
Set a breakpoint on the setTemperature() method in the loop routine.
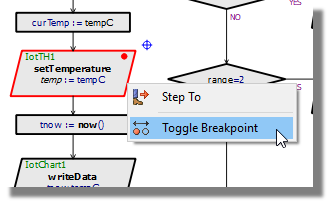
Now run the simulation and change the temperature on the temp sensor.
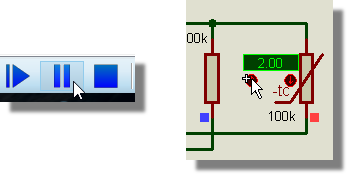
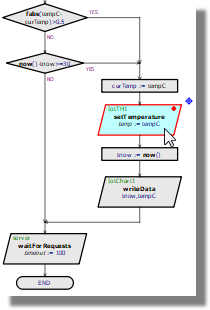
You should find that the program automatically halts and presents you with the source code window with code execution at the breakpoint.
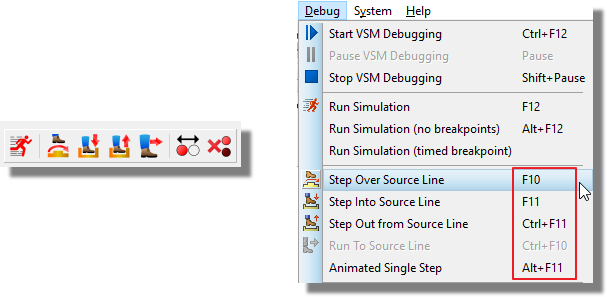
You can now single step your program using the icons at the top, or the keyboard shortcuts shown in the debug menu.
Finally, you can toggle the breakpoint off and stop the simulation when you are finished.
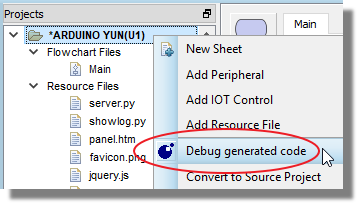
As well as debugging the flowchart it is also possible to debug at source code level. When the simulation is stopped, right click on the Arduino Yun in the project tree and select the debug generated source command from the context menu.
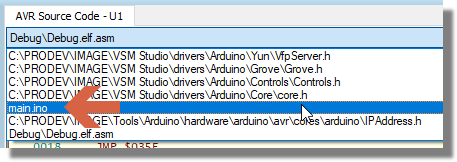
Pause the simulation and select the main.ino source file from the file selector at the top.
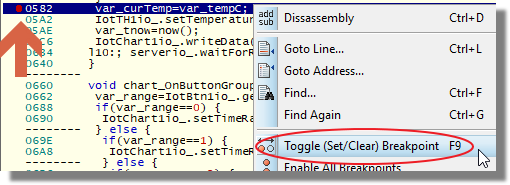
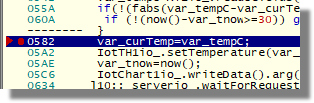
Set our breakpoint in the equivalent source code line, namely var_curTemp = var_tempC;
Run the simulation, wait a few seconds for the front panel to load and adjust the temperature sensor. We should pause at our breakpoint and single step exactly as before.
If you want to you can even single step at machine code level by using the disassembly command on the right click context menu.
Clear the breakpoint via the context menu command and stop the simulation when you are done.
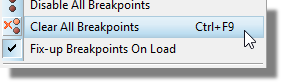
You can return to flowchart debugging by selecting the debug generated source command on the project menu context menu again (it is a toggle).
Advanced Debugging
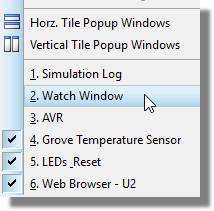
If you are more familiar with the AVR processor and/or the electronics on the schematic then there are a couple of other useful ways to control the simulation. The first is to make use of the watch window to control program flow. The first step is to pause the simulation and then open the watch window from the debug menu.
In our case we want to look at the ADC results because the grove temp sensor is connected to the ADC on the AVR. Right click on the watch window and select the add by name command from the resulting context menu.
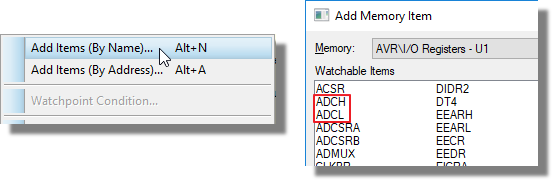
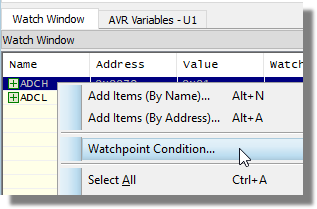
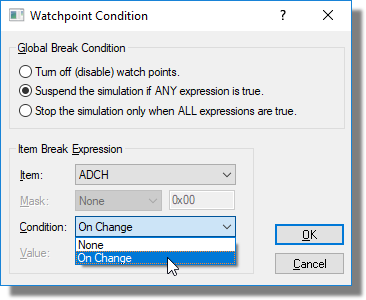
Add both ADCH (high byte) and ADCL (low byte) to the watch window and then run the simulation. Notice that, as you adjust the temperature on the sensor the value of ADCH will increase. You can choose to set a breakpoint (called a watchpoint condition) on or above a particular value. Right click on the ADCH line on the watch window and select watchpoint condition from the resulting context menu.
Select on change and then run the simulation. The program will pause each time you change the temperature.
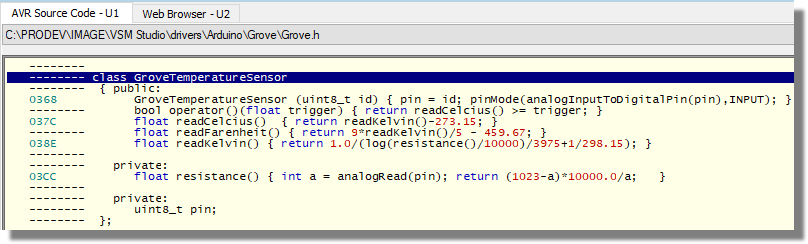
If you really want to understand what is happening here you can switch to source code debugging and repeat the experiment pressing F10 to step once you hit the breakpoint. You'll actually find the ADC conversion code in the grove.h file for the temperature sensor (select from the drop down at the top).
See Also:
You can even set a breakpoint to trigger on a hardware condition. For example, we can trigger on a voltage change on the ADC input line. First, switch to the schematic, select a voltage probe and drop it onto the line.
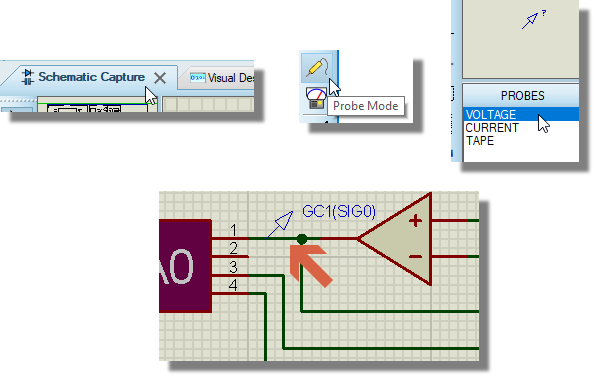
Next, edit the voltage probe and set the breakpoint to be an analogue breakpoint triggering at 3V with arm time of 1 second (to miss any initialisation noise).
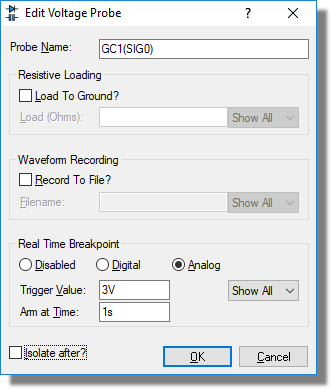
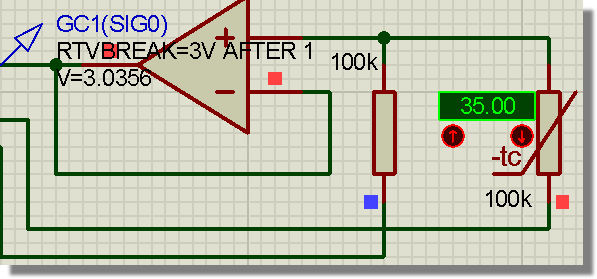
Press play and run the simulation. You should find that as you increase the temperature the voltage across the probe increases and the breakpoint triggers around 35deg C.
See Also:
This last couple of debugging examples are of course a bit more involved that what we have shown previously but it serves as an example that the full professional debugging tools of Proteus VSM are available to you if need be.
Deployment
When we are satisfied with our system we can deploy to the real hardware exactly as discussed in the first tutorial.
See Also:
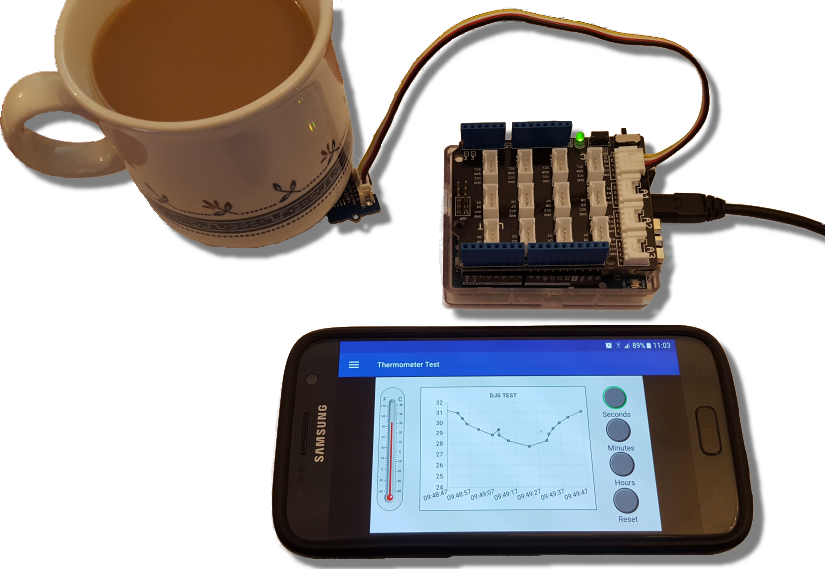
Here's a picture of the running hardware controlled from our mobile phone. We placed the temp sensor beside the coffee cup for a little while to graph some changes.