INTRODUCTION
Introduction
The purpose of this tutorial is to quickly familiarize you with the main features of the Proteus layout module to the point that you can use the package for real work. Users with modest computer literacy should find it possible to learn the package and produce their first board within a day or two.
The tutorial proceeds by taking you through worked examples involving all the important aspects of the package including:
- Board outline / mounting holes.
- Component placement (manual / auto).
- Track routing.
- Design rules such as track thickness and spacing.
- Manual and automatic routing.
- "High-speed design" features such as length-matching and differential pairs.
- Curved tracks.
- Keepout areas.
- Planes / zones.
- Via stitching/shielding.
- 3D Board Visualisation.
- Report generation.
- Output file creation (Gerber files, etc).
- Library part creation.
We do urge you to work right the way through the tutorial exercises as many things are pointed out that if missed will result in much wasted time in the long run. Also, having worked through the tutorial and thus got a basic grasp of the concepts behind the package you will find it much easier to absorb the material presented in the reference chapters.
Note that throughout this tutorial (and the documentation as a whole) reference is made to keyboard shortcuts as a method of executing specific commands. The shortcuts specified are the default or system keyboard accelerators as provided when the software is shipped to you. Please be aware that if you have configured your own keyboard accelerators the shortcuts mentioned may not be valid. You can configure your own keyboard shortcuts via the System - Set Keyboard Mapping command.
Menus, toolbars, icons and help topics all switch when you change between tabs; to reflect the functionality of the module you are working on. When we talk about menu commands or icons in this tutorial we assume that the PCB layout tab is selected. The menu contents will be very different if the schematic tab is selected!
Getting Started Tutorial Movie
See Also:
Application Framework : Backup and Recovery Procedures
Overview of the Layout Editor
We shall assume at this point that you have installed Proteus. This tutorial is a direct continuation from the schematic tutorial; if you have successfully completed the schematic tutorial then we can simply continue with your current design; alternatively you can load the provided sample design with the schematic completed:
From the Home Page in Proteus click on the Open Sample button (or select Open Sample Project from the File menu), filter to the Tutorials category and then select the "IoT Pump (Schematic Only)" sample.
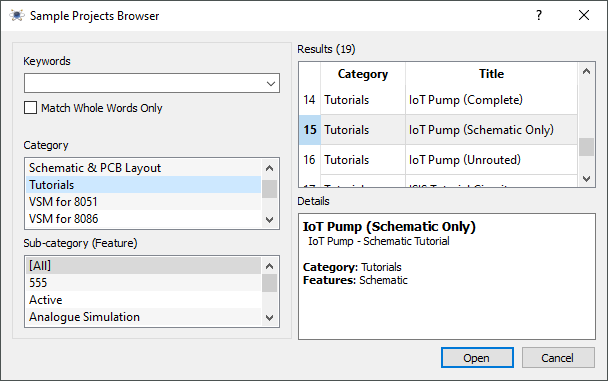
Opening a Tutorial Sample Design
This will open the tutorial project with the completed schematic from the schematic capture tutorial. We can start the PCB layout module from the application module toolbar at the top of the Proteus application.
If you are working on two monitors or have free screen space you can drag and drop one of the tabs to view both modules simultaneously. If not, you can switch between the tabs with the mouse or via the standard windows CTRL+TAB shortcut key.
Much of the look and feel of the application is similar to the Proteus schematic capture module and hopefully now familiar; although there are some important differences.
The Main Window
The largest area of the screen is called the Editing Window, and it acts as a window on the drawing - this is where you will place and track the board. The smaller area at the top left of the screen is called the Overview Window. In normal use the Overview Window displays, as its name suggests, an overview of the entire drawing - the blue box shows the edge of the current sheet and the green box the area of the sheet currently displayed in the Editing Window. However, when a new object is selected from the Object Selector then the Overview Window is used to preview the selected object - this is discussed later.
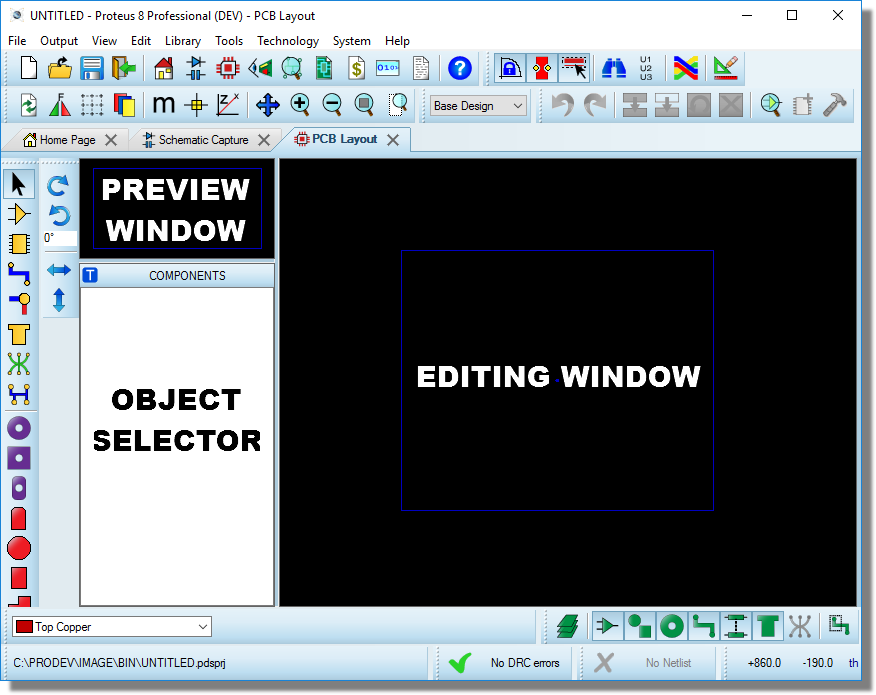
PCB Layout Editor Window
See Also:
Screen Layout (Reference Manual)
The Mode Bar
Similar to the schematic capture module, the mode bar on the left of the window determines the current operating mode; facilitating everything from placing components, to routing tracks, to placing text on the PCB.
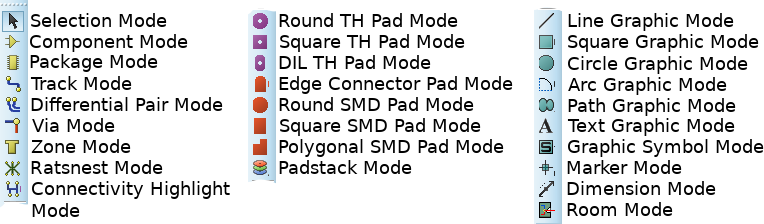
Mode Bar
The Control Bar
The control bar at the bottom of the application is different from what we have seen in the schematic capture module and is essentially split into five sections:
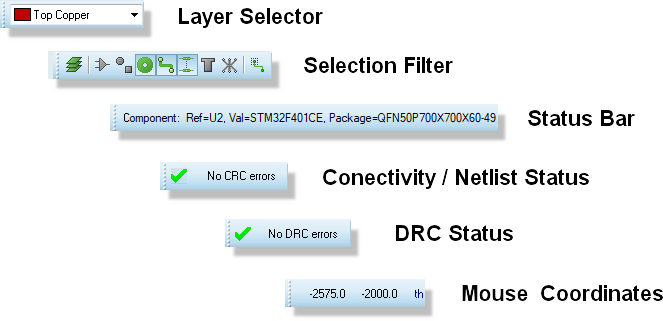
At the left hand side are the Layer Selector and the Selection Filter. The Layer Selector determines which layer will be drawn on with the currently selected mode. The Selection Filter allows you to configure the object types which will be selected in the current operating mode. If the "Single Layer Selection" toggle of the Selection Filter is on, then selection of objects will also be limited to the currently selected layer. Typically, the default rules will suffice and the Selection Filter serves simply as a convenient override where you may wish finer granularity in selection at a given time.

The Layer Selector and Selection Filter
In the middle is the Status Bar which provides textual ‘hints’ on the object currently under the mouse. This is particularly useful when you hover a mouse over a pad for example, as it will inform you which net the pad is on.
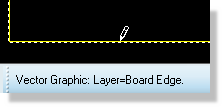
The Status Bar provides additional information on whatever the mouse is currently pointing at
Next, we have the connectivity status which controls the syncing of the PCB to the schematic and, when everything is synchronised, doubles as a live connectivity checker.

Netlist information and CRC information on the status bar
Next to the connectivity status is the live Design Rule Checker. This will report any physical design rule violations that occur while the board is being designed. A left click on this will launch a dialogue detailing the violations with the further option of zooming in to examine a particular error.
DRC information on the status bar
Finally, at the far right hand side is the co-ordinate display which reads out the position of the cursor when appropriate. These reflect not the exact position of the pointer but the location to which it has been snapped. Default snapping options are selectable from the View menu (or via keys CTRL-F1 and F2 to F4) and the snap values can be configured from the Grids command on the Technology menu
Mouse Co-ordinates
The co-ordinates can be in imperial or metric units as set by the Metric (default key mapping 'M') command. You can also set a temporary false origin using the Origin command (default key mapping 'O') in which case the co-ordinates change colour from black to magenta.
The dot grid on the Editing Window can be toggled on and off using the Grid command, or via it’s keyboard shortcut (by default this is ‘G’). The spacing of the dots normally reflects the current snap setting, except when zoomed out. In this case, the dot spacing is set to a suitable multiple of the snap spacing.
An X cursor can be displayed at the position to which the cursor has currently snapped by using the X-Cursor command, default key mapping is 'X'.
We’ll become familiar with all of these toolbars and use them regularly as we work through placement and routing of the board.
See Also:
Selection Filter (Reference Manual)
Navigation
Navigation of the layout (middle mouse zoom, panning, keyboard shortcuts, etc.), is identical to the schematic capture package. Refer to the Schematic Capture Getting Started Guide or the Schematic Reference Manual for more information.
Visual Aids to Design
As in the schematic capture module, Proteus PCB layout will use visual effects to help you understand what is happening during board layout. There are two principle techniques:
- Proteus will ‘twitch’ an object when that object is under the mouse and the selection filter enables selection of that object type. This serves to identify when an object is ‘hot’.
- Dynamic cursors are provided which change to identify what a left click will do at any given time (place an object, select an object, move an object, etc.). A list of cursor types is shown below.
| Cursor | Description |
|
Standard Cursor |
|
Placement Cursor - left click will place an object according to mode. |
|
Selection Cursor - left click will select the object under the mouse. |
|
Movement Cursor - left drag will move the object selected. |


Throughout this tutorial – and indeed whenever you are working in Proteus – you should make use of these visual indicators as an aid to understanding the software.
Proteus 9 includes a multi-level ‘undo’ and ‘redo’ system via the shortcut keys CTRL+Z and CTRL+Y respectively. If you make mistakes throughout the tutorial remember that you can unwind as many times as you need to!
Display Options
Proteus is capable of harnessing the power of your computers graphics card to speed up operation and provide true layer transparency on the layout. However, as not all machines have sufficient graphics cards, the software is also capable of using Windows to perform display and graphical operations. The three modes of operation are called:
- Windows GDI Mode.
- OpenGL Hardware Accelerated Mode.
- Direct2D Hardware Accelerated Mode
Proteus will test your computer when you first open the application and, if possible, will then set a default hardware accelerated mode for you. Control over hardware acceleration and display options can be found via the Set Display Options command on the System Menu. Some options are relevant only to a particular mode and will be disabled if you select a different mode.
Graphics Mode
The first section of the dialogue reports on whether your graphics card will support OpenGL or Direct2D hardware acceleration and, if so, allows you to switch from Windows GDI mode into one of these two modes.
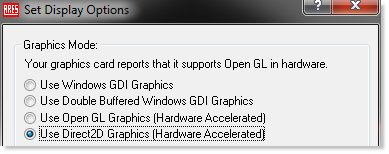
Select the best option that your graphics card supports.
Opacity
When a hardware accelerated display mode is selected the Opacity section of the dialogue allows you to configure the transparency of various layers on the board.
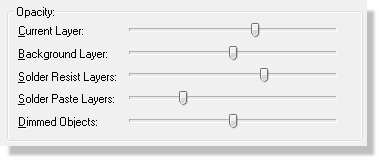
Opacity options
When using hardware acceleration, Proteus places special significance on the current layer, giving it a higher opacity than other copper layers on the layout. This means that objects on the layer you are working are clearly visible and that objects on the other layers of the board are dimmed. You can control the relative opacity of both the current layer and the background layer(s) using the sliders on this section of the dialogue form. For example, if you wish to disable transparency altogether you could set the background layer slider to maximum.
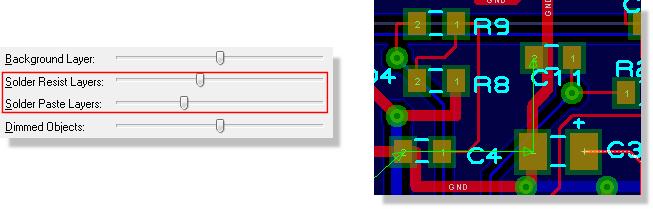
Additionally, with hardware acceleration you can live view the solder resist and paste mask around pads and vias on the layout (turn on/off from View Menu - Layers). When enabled, you can also adjust the opacity of these layers using the appropriate slider controls
If you are working on complex,multi-layer PCB's it can be useful to define a number of preset views for the board. This is done by creating new colour sets in the displayed layers dialogue (e.g. TOP_VIEW, BOT_VIEW) with appropriate layers visible, and assigning them keyboard shortcuts.
See Also:
Auto-Pan Animation
In Proteus, holding down the shift key and bumping the mouse against the edge of the Editing Window allows you to pan the screen. Similarly, dragging an object against the edge of the Editing Window will pan the screen in the direction of the drag. This navigation feature is called auto-pan and is controlled via the options in this section of the dialogue form.
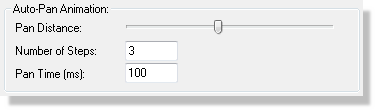
Auto-Pan options
You can adjust the distance moved on auto-pan (pan distance), the number of steps taken to cover this distance (number of steps) and the speed of the animation (pan time). These options are available regardless of which mode of operation you have specified.
Highlight Animation
When working in hardware accelerated mode objects under the mouse with smoothly increase their intensity to inform you that they are selectable. The highlight animation options on this dialogue allows you to control the smoothness and speed of this effect.
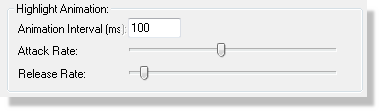
Animation Speed options
The animation interval controls the frame rate of the animation and therefore the smoothness of the fade-in/fade-out effect. Normally, the default value for this is suitable.
The attack rate specifies the speed at which an object will go from ‘fully off’ to ‘fully on’ whilst the release rate allows you to adjust the speed at which an object will return from ‘fully on’ to ‘fully off’.
These options are only available in hardware accelerated modes.
Multi-Sampling (Anti-Aliasing)
Multi-Sampling is a method used by graphics cards to reduce anti-aliasing effects when graphics are displayed at different zoom levels. It is particularly applicable to text but impacts on all graphics on the layout.

When working in OpenGL mode you can specify the level of multi-sampling you want to use. The higher the level of multi-sampling the better the resulting display but the more GPU resources are consumed. If you select a level of multi-sampling which is not supported by your graphics hardware the software will reset the level to the closest one which your card can handle. For normal operation in Proteus a multi-sampling level of 4x is quite sufficient.
Displayed Layers Dialogue
The displayed layers dialogue allows you to control the visibility and colour of the various layers on the board. You can launch this from the View menu or by clicking the mouse on the status bar at the bottom of the application.
You can change the colour of a layer by clicking on the colour beside the layer and you can control the visibility of the layer via the checkbox beside the layer (where appropriate). All changes are updated live on the layout.
You can switch between the pre-supplied colour profiles (print and screen), create your own colour profiles via the 'new' button at the top of the dialogue form, and assign keyboard shortcuts to colour profiles. This allows you for example to have a TOP colourset showing only top copper, top silk, top resist and top paste mask. More information is available via the help (?) icon on the top right of the window.
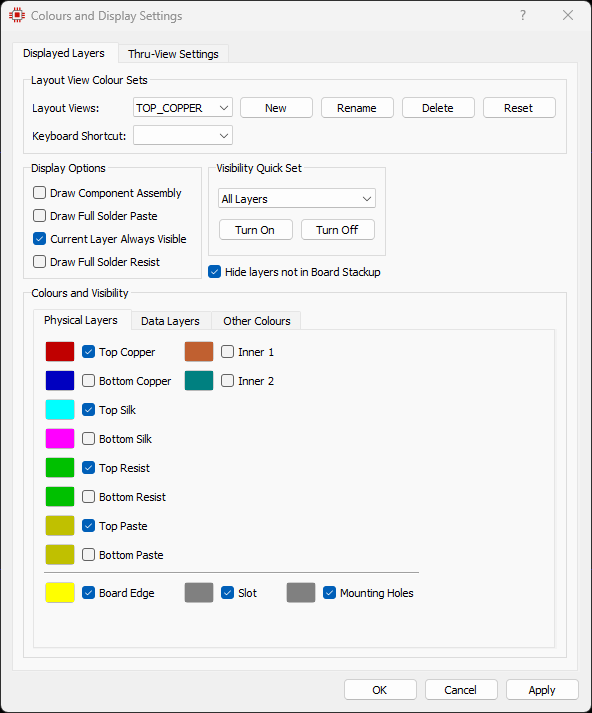
Finally, if you are working in OpenGL or Direct2D mode, the Resist/Paste Mask Display options allow you turn on full display of these layers on the board, showing the resist and paste coverage around pads and vias. When enabled you can change the intensity of these layers by switching to the Thru-View settings tab and adjusting the appropriate slider controls.