THE GRAPH WINDOW
Overview
A graph sitting on the schematic is deliberately small, because its job there is to show you the shape of the result alongside the circuit that produced it. When you want to read values off the traces, a graph can be opened in a window of its own, where it fills the editing area and can be panned, zoomed and measured with cursors.
There are two ways to open a graph in its own window:
- Tag the graph and then left click on its title bar.
- Select the graph by name from the list at the foot of the Graph menu.
The graph you open becomes the current graph, so the commands on the Graph menu act on it. The window carries five menus of its own and a toolbar, and it keeps the graph commands you use most within reach. Close the window to return the graph to the schematic.
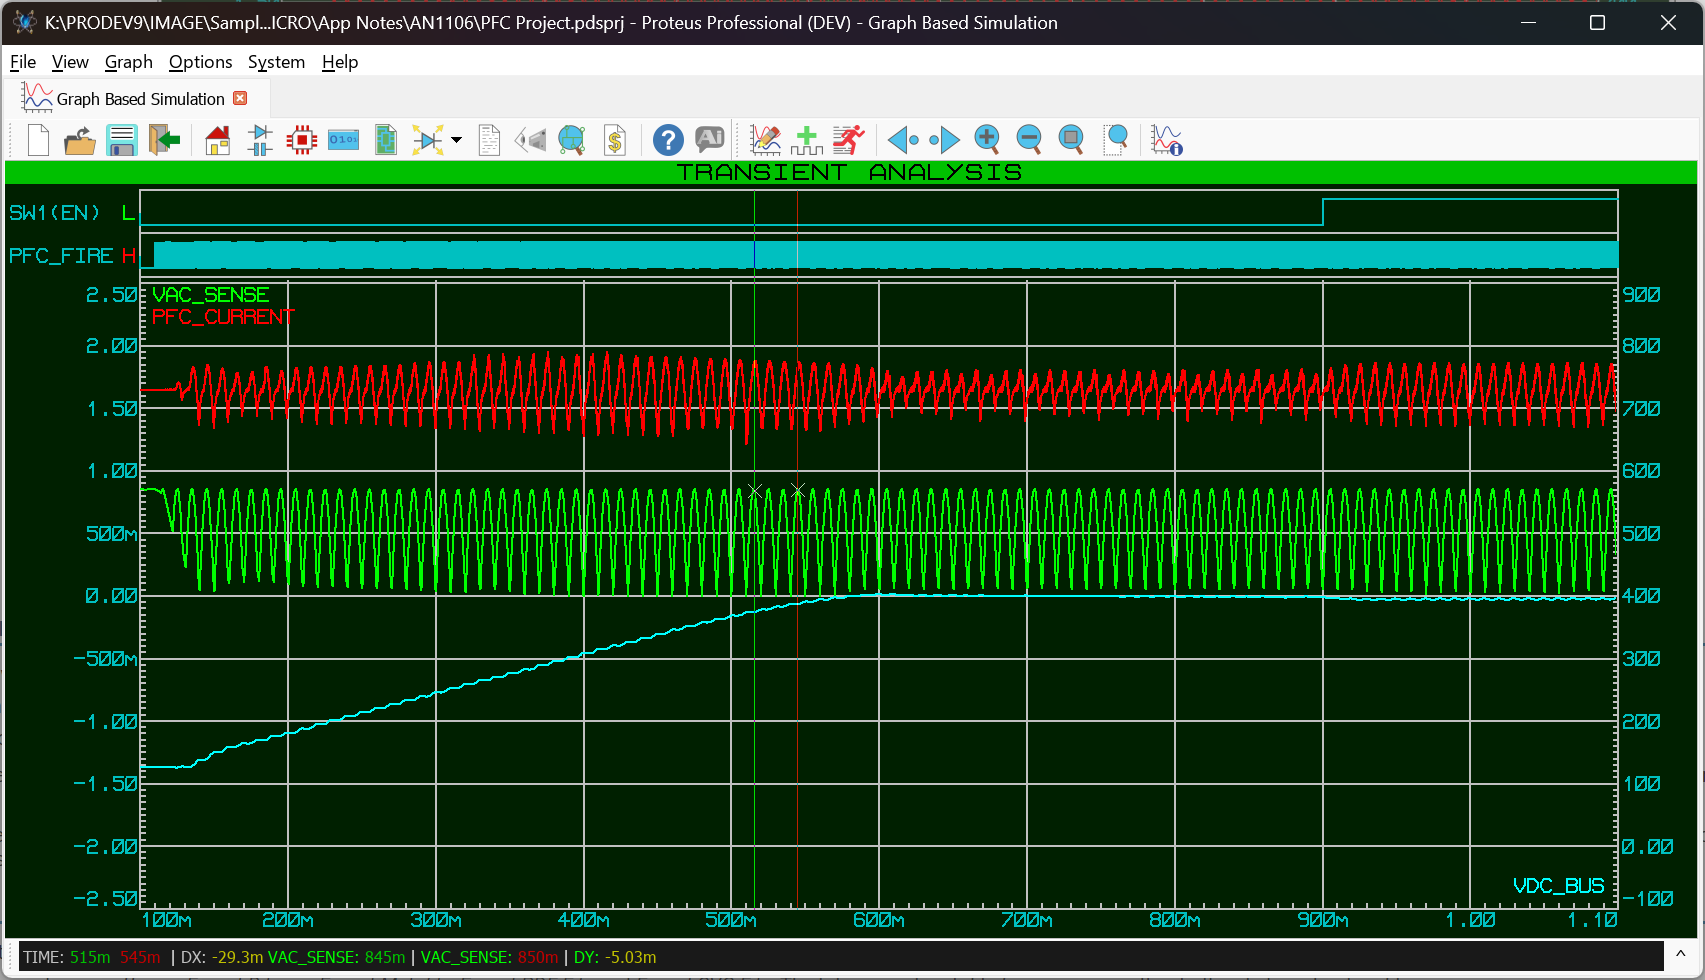
A transient graph opened in its own window, with both cursors placed and the readings shown on the status bar
Cursors and Measurements
Cursors are the reason the graph window exists. Two are available, and you place them with the mouse:
- Left click on the graph to place the first cursor at that point.
- Hold CTRL and left click to place the second cursor.
Keep the mouse button down after placing a cursor and you can drag it along the graph. Each cursor attaches itself to a trace as you place it: dropped over the digital band at the foot of the graph it locks to the digital trace under the pointer, and elsewhere it takes the nearest analogue trace at that point.
The measurements appear on the status bar at the foot of the window. The x axis readings are shown at the left and the y axis readings at the right, each in the colour of the cursor it belongs to. With both cursors placed you also get the difference between them, labelled DX for the x axis and DY for the y axis, which is the quickest way to measure a pulse width, a period or a voltage swing.
The File Menu
The File menu deals with getting the graph out of Proteus and on to paper or into a document.
- Export Graphics opens a submenu offering Export Bitmap, Export Metafile, Export PDF File and Export SVG File. The bitmap and metafile forms can go either to the clipboard or to a file.
- Print Graph prints the current graph.
The View Menu
The View menu moves you around the graph. It offers Pan Graph Left and Pan Graph Right, which shift the view along the x axis, and four zoom commands: Zoom In, Zoom Out, Zoom To View Entire Sheet, which returns you to the whole run, and Zoom To Area, which lets you drag out the region you want to inspect. The mouse wheel zooms in and out about the pointer as well.
The Graph Menu
The Graph menu begins with Undo Changes (CTRL+Z) and Redo Changes (CTRL+Y), which step through the changes you have made to the graph.
Below these are the same graph commands that appear on the schematic's Graph menu, so you can edit the graph, add traces to it, run it and read its log without going back to the schematic: Edit Graph..., Add Traces... (CTRL+T), Simulate Graph (the space bar), View Simulation Log (CTRL+V), Export Graph Data..., Clear Graph Data... and Play Audio (CTRL+SPACE).
The Options Menu
- Set Graph & Trace Colours configures the colours used for the graph itself and for the sequence of trace colours. This is the same command as the one on the schematic's Template menu, so you can also reach it without opening a graph window.
- Set Graph Sheet Size sets the current and general sheet sizes used when the graph is printed or exported.
- Set Simulation Options opens the tabbed simulator options form for this graph, letting you adjust the SPICE tolerances and iteration limits it runs with. See Simulation Options.
The Help Menu
The Help menu offers Schematic Capture Help, Simulation Help, which opens this manual, and VSM Model/SDK Help for model development.
See Also: