THE WATCH WINDOW
Adding Items to the Watch Window
Whereas the variables, memory and register windows belonging to processor models are only displayed when the simulation is paused, the Watch Window provides a means to display values that are updated in real time. Each item can be given a name of your own choosing as it is added, which is a good deal more manageable than hunting for the address again in a memory window; the Add Items (By Address)... dialogue has a Name field for exactly that purpose.
To add an item to the Watch Window:
- Press CTRL+F12 to start debugging, or pause the simulation if it is already running.
- Display the memory window containing the item to
be watched, and the watch window itself, using the numbered options
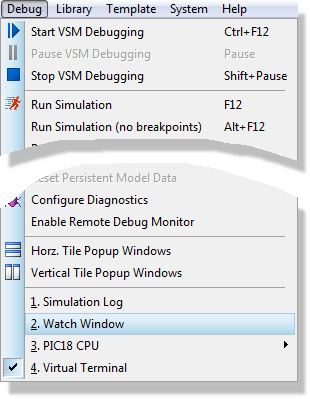
on the Debug menu.
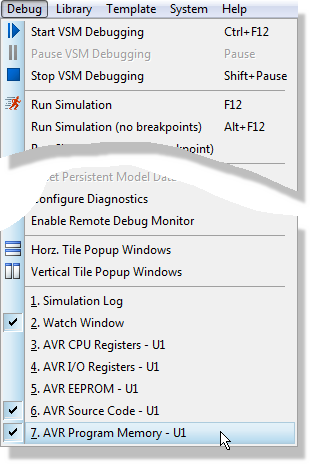
If you are working with the VSM Studio IDE the Watch Window is (by default) a docked tab at the bottom of the IDE. If you are working directly the watch window will launch as a floating window which you can then dock at the bottom of the schematic window if you prefer.
The memory window behaves the same way, appearing either inside the IDE or over the schematic according to where you are debugging.
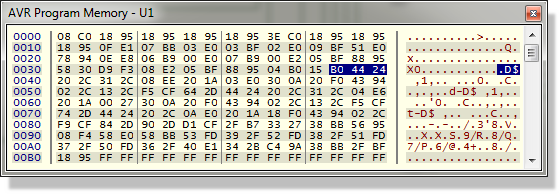
- Mark a memory location or range of memory locations
using the left mouse button. The selected range should appear in inverted
colours.
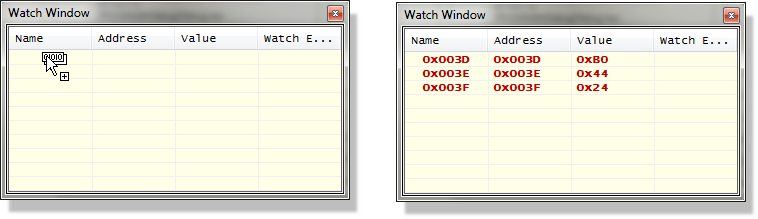
- Drag the selected item(s) from the memory window
to the watch window.
You can also add items to the Watch Window by using the Add Items (By Name)... or Add Items (By Address)... commands on its right mouse button context menu. Both open a dialogue form titled Add Memory Item. Adding by name is particularly useful for the SFRs in microcontrollers, which can be expanded to monitor individual bitfields; every microcontroller model registers its special function registers this way.
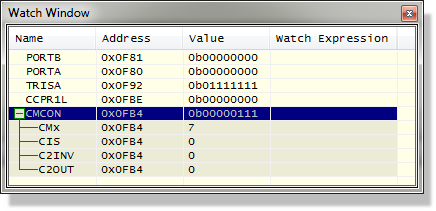
Watch Window monitoring the CMCON register of the PIC18
Modifying Items in the Watch Window
Having got an item or items into the window, you can select an item with the left mouse button and then use the right mouse button context menu to change how it is interpreted and how it is displayed.
The Data Type sub-menu offers ASCIIZ String, Byte, Word, Double Word, Quad Word, IEEE Float (4 bytes), IEEE Double (8 bytes), HiTech Float (3 bytes) and Microchip Float (4 bytes). For a type that comprises several bytes, the second and subsequent bytes are taken from the addresses following the item address, so to display a multi-byte word or a string you only need to drag in the first byte from the memory window. Below the types is a Big Endian option, available on any type larger than a byte, which reverses that order for targets that store the most significant byte first.
The HiTech Float and Microchip Float types are the answer to the floating point ambiguity in the COF format described under Supported Debug Formats. If a float from a PIC compiler reads as nonsense, add it to the watch window and try the other float type.
The Display Format sub-menu controls how the value is written out and offers Binary, Octal, Hexadecimal, Signed Integer, Unsigned Integer, Floating Point and ASCII Text. The two decimal renderings are Signed Integer and Unsigned Integer.
The rest of the menu covers presentation and housekeeping: Show Addresses?, Show Types?, Show Previous Values?, Show Watch Expressions? and Show Gridlines? control what the window displays, Set Font... and Set Colours... control how it looks, and Select All, Copy To Clipboard, Find Item and Delete Item do what their names suggest.
Watchpoint Conditions
The Watch Window provides a facility to suspend the simulation when a particular condition arises in the values of the items. At the simplest level this is the On Change condition, which fires whenever the value of a particular item changes, but you can also specify more complex conditions if necessary.
To specify a Watchpoint Condition
- Press CTRL+F12 to start debugging, or pause the simulation if it is already running.
- Display the watch window itself using the option
on the Debug menu.
- Add the items on which the watchpoint condition will depend to the watch window as described in the previous section.
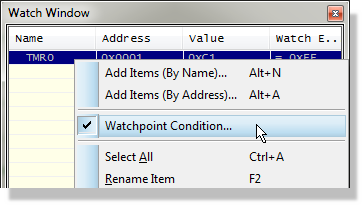
- Select the Watchpoint Condition... command from the
right mouse button context menu.
- Choose a Global Break Condition. There are three settings: turn watch points off altogether, suspend the simulation if any expression is true, or stop it only when all the expressions are true. The first of these is how you switch a set of watchpoints off without deleting them.
- Specify one or more item break expressions. An item break expression consists of the watch item on which it operates, an operator and a mask value, a condition and a value to test against.
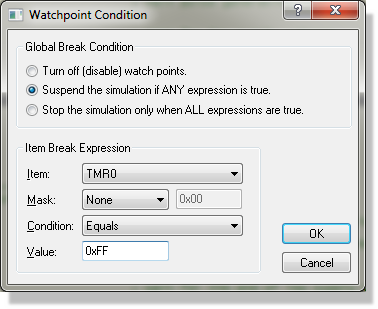
The Watchpoint Condition dialogue form
Two points about the expression are easy to miss. The mask has an operator of its own, sitting immediately to its left and offering None, AND, OR and XOR: a mask value alone does nothing until that operator is set, and the combination is what lets you watch particular bits of a register rather than the whole of it. The condition itself offers None, On Change, Equals, Not Equals, Greater Than, Greater or Equal To, Less Than and Less or Equal To.
Activating a watchpoint condition will impose a modest overhead on the simulator since ProSPICE must re-test the condition at every time-point in the simulation (that is, at or above the machine cycle rate in a microcontroller application). However, the facility can be a god-send when looking for obscure bugs and the fact that the simulation may take a few extra minutes to reach the point of interest is not normally an issue.
See Also: