POPUP WINDOWS
Overview
Most microprocessor models written for Proteus VSM create a number of popup windows which can be displayed and hidden from the Debug menu. The simulator itself adds a further set which is always present, whatever is on the schematic. All of them share the same framework, so they dock the same way, they remember their position and size, and they all carry a right button context menu.
Types of Popup Window
| Window | What it shows | Documented in |
| Status window | The processor registers. A processor model will generally use one of these to display its register values. | The help topic for the processor model |
| Memory window | The contents of one memory space. Typically there will be one of these for each memory space in the processor architecture. Memory devices (RAMs and ROMs) also create these windows. | This topic |
| Source code window | Your program source, with the current line marked. One is created for each processor on the schematic. | The Source Code Window |
| Variables window | The program variables and their current values, with compound types and pointers expandable. | Variables Window |
| Watch window | Named memory locations and variables, updated live while the simulation runs, with optional watchpoint conditions. | The Watch Window |
| Simulation log | Every error, warning and diagnostic message produced by the simulation run. | The Simulation Log |
| Stack window | The call stack. Models which can unwind the stack (the Cortex-M4, megaAVR, MicroPython and Arduino models) create one. Selecting a frame in this window changes which set of local variables the variables window shows. | The help topic for the processor model |
| Object browser | The live object tree of an interpreted target, used by the MicroPython models. | The help topic for the processor model |
| Active popup | A live view of an area of the schematic, so that you can watch and interact with the circuit from inside the IDE. | Active Popups |
| Virtual instruments | The oscilloscope, logic analyser, terminals, signal and pattern generators, counter/timer and the system meter. | Virtual Instruments |
Displaying a Popup Window
To display a popup window:
- Start debugging mode by pressing CTRL+F12, or if the simulation is already running, click the Pause button on the Animation Control Panel.
- Press ALT+D to open the Debug menu and then the number shown against the window you want.
The windows are numbered in the order the models created them. The first ten carry the number as a keyboard mnemonic; any beyond the tenth are still listed and can still be selected with the mouse, but they have no keyboard shortcut. Where the schematic holds more than one processor, each model's windows are gathered into a sub-menu of their own so that the top level of the Debug menu stays readable.
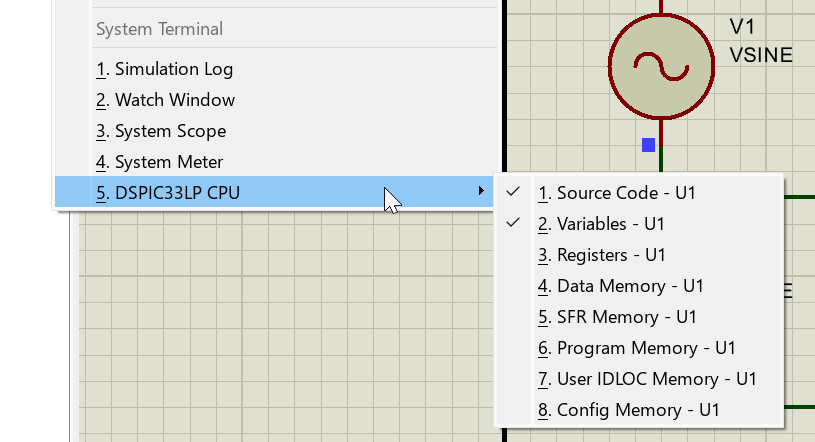
The Debug menu listing the popup windows created by the processor model, each with its ordinal number
Hiding and Docking
The status, memory, source code and variables windows belong to the processor model and are only meaningful while the simulation is paused. They are hidden automatically when you press Run and reappear, in the same places, when the simulation next pauses, either manually or on a breakpoint. The watch window, the simulation log and the system instruments are not hidden: they stay on screen and update live throughout the run.
Every debug window is dockable, whether you are debugging directly on the schematic or from inside VSM Studio. Most start life floating over the schematic and can be dragged into the dock area at the bottom of the window, where they tab alongside each other and save a good deal of screen space. The System Scope and the System Meter are docked there by default.
If the layout gets into a state you do not want, Debug > Reset Debug Popup Windows restores the default colours, positions and sizes for every debug window.
Context Menus
All the debug windows have right button context menus: point at the window and click the right mouse button. Most of the commands control the appearance and formatting of the data, offering a choice of data type, a display format, gridlines, fonts and colours, and options to highlight changed values or show the previous value alongside the current one.
Three commands are worth knowing about because they are not cosmetic at all. Goto moves the memory window straight to an address rather than making you scroll to it, Copy All puts the whole window on the clipboard, and Export writes the contents out to a file.
The System Terminal
Debug > System Terminal opens a serial terminal which docks at the bottom of the window alongside the other debug windows. It is a real terminal attached to a physical COM port on your PC, not a simulated one, so it is the tool to reach for when the design talks to hardware outside the simulation. It understands VT100 escape sequences, and its context menu offers Line Mode, which buffers what you type and sends it a line at a time, and COM Settings, which sets the port, the baud rate, the word length, the parity and the number of stop bits.
To talk to a serial port inside the simulation itself, place a Virtual Terminal instrument on the schematic instead.
See Also: