What ProPilot Can Do
Introduction
ProPilot is not limited to conversation. It has a substantial set of tools through which it can act on your design: it can place probes and generators, run simulations, take numeric measurements from graphs, read virtual instruments, create and build firmware projects, and construct library parts. This topic is a reference to those capabilities, organised by what you are trying to do.
Two points frame everything below. The first is that the assistant works through the same mechanisms you do, so anything it does appears in your design as a normal edit and can be undone in the normal way. The second is that it asks before it acts on anything consequential, and you remain the engineer: the tools make the assistant useful, they do not make it autonomous.
Each section ends with a short note naming the underlying tools. You never need to type these names, but they are useful if you want to ask for something specific, and they are the vocabulary an external chat client will use if you work over MCP.
The capabilities described here are available to the built-in chat window and to an external chat client connected over MCP. Only the schematic drawing tools are gated behind a setting; everything else is always available.
Understanding the Design
Everything else rests on the assistant being able to see what you have drawn. It can read the netlist, either whole or restricted to the part of the circuit under discussion; look up an individual component's properties, pins and connections; list what is waiting in the parts bin; identify the processors in the design and whether they already have firmware; and capture an image of the sheet or a region of it so that it can look at the layout rather than just the connectivity.
It can also compare the current netlist against an earlier state, which is how it can tell what has changed since it last looked, and suggest values for components where a sensible value can be derived from the surrounding circuit.
For teaching purposes it can also set and clear component faults, which is the mechanism behind ProTutor's fault-finding exercises.
Under the hood:
schematic_get_design_info, schematic_get_netlist, schematic_get_partial_netlist, schematic_get_netlist_changes, schematic_get_component_info, schematic_get_device_info, schematic_list_parts_bin, schematic_list_processors, schematic_get_image, schematic_suggest_values, schematic_set_fault, schematic_clear_fault.
Measuring and Probing
This is the area users are most often surprised by, because it means the assistant can obtain simulation results itself rather than relying on you to read them off and type them in.
Placing Probes and Generators
ProPilot can place voltage and current probes on a net or a component pin. A current probe has to be inserted into a wire, so it will ask for or find a suitable wire to split.
It can also place any of the Proteus generator types and set their properties. The analogue types are DC, Sine, Pulse, Exp, SFFM, Pwlin, Random, File and Audio; the digital types are DState, DEdge, DPulse, DClock, DPattern and Scriptable, the last of these driven by an EasyHDL script. Placing a generator on an existing wire isolates the node so that the generator drives the downstream net, which is normally what you want when injecting a test signal into a circuit that is already wired.
Placing Graphs and Running Simulations
ProPilot can add a graph to the sheet and choose a sensible place for it, avoiding the circuitry. All thirteen Proteus graph types are available: Analogue, Digital, Mixed, Frequency, Transfer, Noise, Distortion, Fourier, Audio, Interactive, Conformance, DC Sweep and AC Sweep. It can add traces to a graph, remove them, set graph properties, adjust the axes, and run the simulation.
Reading the Results
Once a graph has been simulated, ProPilot can read it in two ways. It can capture the graph as an image and look at it, which is how it comments on the shape of a response. More usefully, it can take precise numeric measurements:
| Measurement | Returns |
| Minimum and maximum | The lowest and highest values reached by a trace over a given span of the x-axis. |
| RMS | The root mean square of a trace over a given time window. |
| Mean | The mean value of one or more traces over a given time window. |
| Period | The periods measured on a trace, which needs at least two cycles in the window to be meaningful. |
| Y values at given X | The value of one or more traces at specified points on the x-axis, equivalent to dropping a vertical cursor. |
| X values at given Y | The points at which a trace crosses specified values, equivalent to a horizontal cursor. This is how a cutoff frequency or a rise time gets measured. |
| Digital events | The transitions on one or more digital traces between two points in time. |
This is what makes an iterative tuning conversation work. You can ask for a filter, have it simulated, ask what the actual cutoff frequency turned out to be, and get a measured number back rather than an estimate.
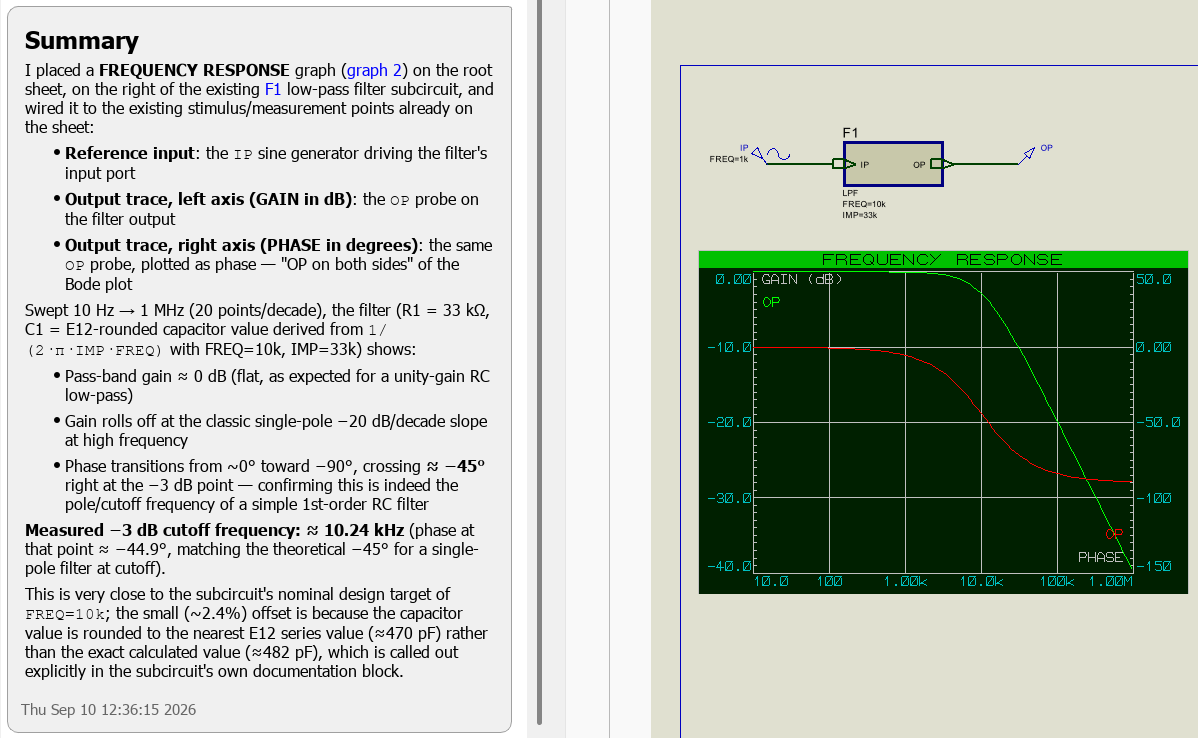
ProPilot placing a generator and a graph on a filter circuit, running the simulation, and reporting the measured cutoff frequency.
Under the hood:
schematic_place_probe, schematic_place_generator, schematic_place_graph, graph_simulate, graph_get_info, graph_get_image, graph_get_log, graph_add_trace, graph_remove_traces, graph_set_property, graph_zoom, graph_measure_analog_min_max, graph_measure_analog_rms, graph_measure_analog_means, graph_measure_analog_period, graph_measure_y_values, graph_measure_analog_x_values, graph_measure_digital_events.
Conformance Regression
A conformance graph can hold a stored reference dataset, which turns simulation into a regression test: you capture the behaviour you believe to be correct, and afterwards you can ask whether it still holds.
ProPilot can store the current results of a conformance graph as the reference baseline, discard a stored baseline to return the graph to normal use, and run a conformance check across every verifiable graph in the design, reporting which passed and which failed. When taking measurements it can also choose whether to read the current results or the stored reference, so it can quantify a difference rather than just report that one exists.
This is a natural fit for firmware work, where you want to know that a change to the code has not altered the behaviour of a peripheral you were not working on.
Under the hood:
graph_store_reference, graph_clear_reference, graph_run_conformance, and the dataset option on the measurement tools.
Interactive Simulation
ProPilot can drive an interactive simulation as well as a graph-based one. It can start, pause and stop the simulation, and run for a set period of simulated time; it can wait for a running simulation to reach its breakpoint before continuing; and it can read the operating point of every component in the circuit.
It can also work with the virtual instruments. It can list the instrument popups on the schematic, read a popup's contents as structured data, and capture a picture of it. For instruments whose displays are dim or coloured, it can request an enhanced view that darkens the unlit areas or drops the image to greyscale so that every lit segment reads clearly, which makes a seven-segment display or an LCD far more legible to a model than the natural rendering. It can also probe a named net to obtain its value while the simulation is running.
Components with visible state, such as switches, LEDs and displays, can be listed, queried for their state, and captured as images.
Under the hood:
interactive_runctrl, interactive_wait, interactive_get_status, interactive_get_operating_point, interactive_get_log, interactive_list_components, interactive_get_component_states, interactive_get_component_image, interactive_list_popups, interactive_get_popup_data, interactive_get_popup_image, interactive_probe_net.
Firmware
Where the design contains a processor, ProPilot can work on the firmware as well as the circuit. It can list the processors in the design and tell you which of them already have a firmware project; list the toolchains available for a given processor; and create a firmware project, optionally generating the initial sources.
It can add a peripheral to the project, and this does more than it might sound: adding a peripheral places the peripheral's sub-circuit on the schematic and binds its driver into the firmware in a single operation, so the hardware and the code arrive together. It can also list the peripherals available and report the methods a peripheral driver offers.
On the code itself, it can read a file, create one, replace one wholesale, or apply a set of targeted search and replace edits, which is the usual way it makes a small change without rewriting the file. It can build the project and read the compiler output, and it can produce a unified diff of your own edits so that it can see what you have changed by hand.
Under the hood:
firmware_create_project, firmware_list_toolchains, firmware_get_project_info, firmware_list_peripherals, firmware_get_peripheral_methods, firmware_add_peripheral, firmware_get_file, firmware_create_file, firmware_update_file, firmware_change_file, firmware_remove_file, firmware_get_unified_diff, firmware_build, firmware_get_compiler_output.
Library Parts
ProPilot can build a complete library part, comprising a schematic symbol, a PCB footprint and the part definition that ties them together, from the information you give it. It searches the existing libraries for a suitable symbol and an IPC-7351 footprint before constructing anything itself, and submits the result to the Import Parts dialogue for you to inspect and refine before anything is saved.
This is covered in full, with a worked example, in the ProPilot topic.
Under the hood:
library_search, library_view_item, library_get_pdif_spec, library_get_preview, library_import_part.
See Also:
Worked Example: Microchip PAC1811
Proteus Documentation
ProPilot can search the Proteus documentation, and does so through a purpose-built index rather than a simple keyword match. This is what allows it to answer questions about how to use Proteus itself, and it is described in more detail under Proteus Documentation Help.
See Also:
Schematic Drawing Tools (beta)
ProPilot can also draw. This part of the toolkit is newer than the rest and is disabled by default, because it is still under active development and is not yet fully functional. That is the wording the product itself uses, and it is honest: the tools work, but they will not reliably produce a finished schematic without supervision.
To enable them, open the settings dialogue, select the MCP Server tab, and tick Enable schematic drawing tools (beta). The setting applies both to the built-in assistant and to any external chat client. It affects only the drawing tools; probes, generators and graphs are not gated by it and work whether or not it is ticked.
With the option enabled, the assistant can place devices from the libraries and place terminals; route nets between pins; delete objects and clear the wiring from a net; change a component's value; nudge an object by whole grid steps; set the working grid; preview an object before placing it; and rewind a batch of edits it has already committed.
How the Edits Are Grouped
Drawing edits are made inside a transaction. The assistant opens a transaction, makes its changes, and closes it, and the whole batch becomes a single entry in the Proteus undo history. This matters in practice: if you do not like what the assistant has drawn, one undo removes all of it rather than leaving you to pick the changes apart. The assistant can also abandon a transaction itself, which commits and immediately undoes the batch, or rewind a batch it committed earlier.
Coordinates in these tools are expressed in thou, where 100 thou is 0.1 inch and one standard schematic grid step. The exception is nudging, which is expressed in whole grid steps.
Treat the drawing tools as a drafting assistant working on your sheet, not as an autonomous layout engine. Review what has been drawn before you build on it, and remember that a single undo will remove a whole batch of edits if the result is not what you wanted.
Under the hood:
schematic_begin_transaction and schematic_end_transaction are always available, since opening and closing a transaction changes nothing on its own. The gated tools are schematic_place_device, schematic_place_terminal, schematic_route_nets, schematic_set_grid, schematic_preview_object, schematic_rewind, schematic_delete, schematic_clear_wires, schematic_set_component_value and schematic_nudge.
See Also: