DEBUGGING SKILLS
Overview
When developing your embedded system you may want to test your program as it evolves and you will certainly want to test it when it is complete. It is a rare occasion when everything works perfectly first time and you'll therefore also need to debug your program in order to find and fix errors.
Visual Designer makes this process extremely simple because it all happens in software. The following topics summarize the essential skills needed to simulate, debug and measure with Visual Designer. It's assumed at this stage that you are familiar with all the required editing skills and have a project ready for testing.
System Level Simulation
When you add peripherals and control them in your flowchart program you are building an embedded system. Loosely speaking, there will be the microcontroller board and some hardware pieces representing the peripherals. Running a system level simulation is the real power of Proteus because you are simulating the microcontroller together with all of the analog and digital electronics connected to it. This allows you to interact with ,test and debug your project entirely inside the Proteus software suite.
To start a simulation
To begin simulating either press the F12 shortcut key or the play button on the animation control panel. Your program will compile and simulation progress will be reported on the status bar.

When you start the simulation the time elapsed is shown on the status bar.
To stop a simulation
To end a simulation either press the ESCAPE shortcut key or the stop button on the animation control panel. The program will stop and Visual Designer will return to the Editing Layout

Stop the simulation via the Control Panel.
To pause a simulation
Pausing the Proteus system level simulation is an important concept; you are effectively stopping time. For example, your capacitors wont discharge and your motors will maintain their angular position and their momentum. This allows you to inspect both your program and your virtual hardware and when you single step debug the entire system will advance in time synchronously. Your embedded system works to the clock on the status bar, not the clock on the wall and you are in charge of the clock ! It's enormously powerful and we'll see many uses in both these topics and more practically in the tutorials.
To pause a running simulation either press the PAUSE button on the keyboard or click the pause button on the animation control panel.
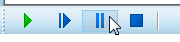
Pausing a Simulation
A simulation will also be automatically paused at a breakpoint. Breakpoints are discussed in the Debugging Skills topic below and demonstrated in the various tutorial topics.
Whenever the simulation is paused, Visual Designer will switch to full debugging layout and both the flowchart and the various debug windows will become available for inspection and interaction.
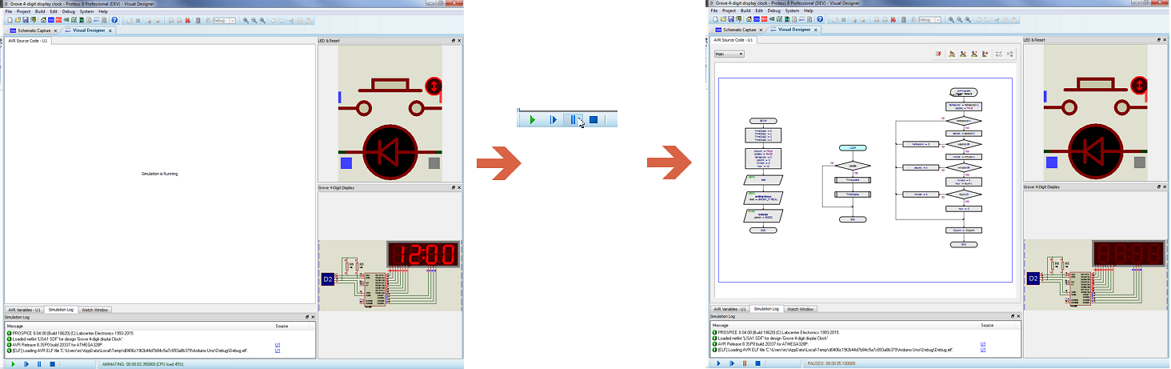
Pausing the Simulation prepares Visual Designer for debugging.
You don't see the flowchart during free running simulation because the program is executing so quickly that actually showing it's current position would be impossible.
To interact with a simulation
When the simulation is running you will see Visual Designer in it's debugging layout, with all the interactive elements aligned on the right hand side of the application. These will almost certainly be a mix of indicators (led's, LCD's, etc.) that provide you with feedback and actuators (buttons, switches, keyboards, etc.) that you click to provide stimuli to the simulation. Here's an example where we adjust an infra-red proximity sensor:
1) Start the Simulation
2) Move the mouse over the adjustment arrows on the sensor.
3) Click up or down as required.
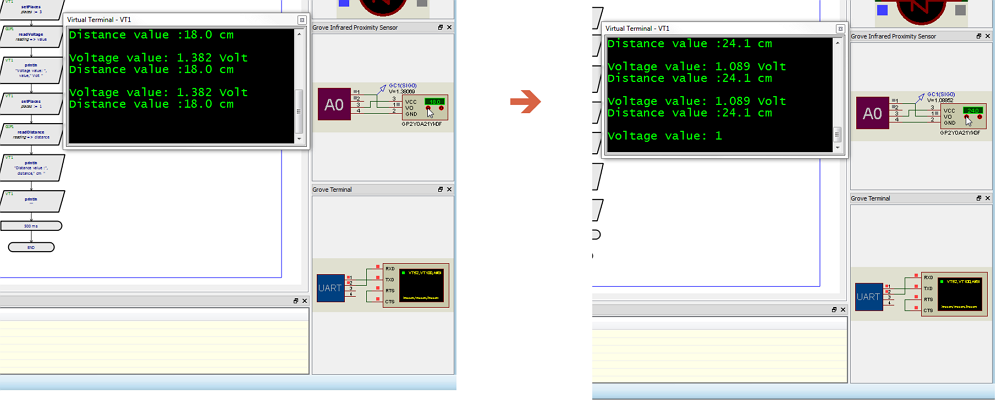
Clicking on the IR sensor adjustment controls mimics the behaviour of a physical test.
You can just as easily switch to the schematic tab and interact on that screen if you prefer. However, it's handy to have everything in one place and particularly so during a debugging session when you want to view hardware while single stepping your flowchart.
The virtual terminal is slightly different as you can simply click and type when the simulation is running. This means you can use the terminal as a command interface to your program which has many, many uses.
Debugging Skills
To set a software breakpoint
Right click on the flowchart block either before simulation or when the simulation is paused and select the toggle breakpoint command from the context menu.
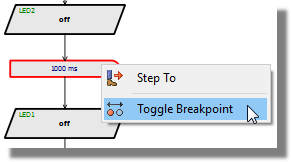
To single step debug your flowchart
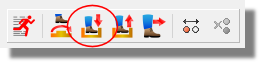
When the simulation is paused, use the step commands at the top of the window or the F10 and F11 shortcut keys to single step through your flowcode.
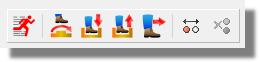
To watch the program flow it is often helpful to try a simulation run by pressing pause and then the animated single step command from the Debug Menu. This is slow enough that you can see the path your program executes through decision blocks and is often a quick way to spot a problem.
To step to a block on the flowchart
To step to a specific block on the flowchart, first pause the simulation, then right click on the block and select the Step to command from the context menu.
To set a timed breakpoint
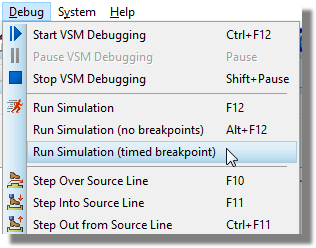
It's occasionally useful to pause a simulation after a period of time rather than on a particular flowblock. You can do this by selecting the Run Simulation with Timed Breakpoint command from the Debug Menu.
To set a hardware breakpoint
You can also set a breakpoint on a hardware condition as opposed to a software condition. The procedure is:
1) With the simulation stopped switch to the schematic capture tab.
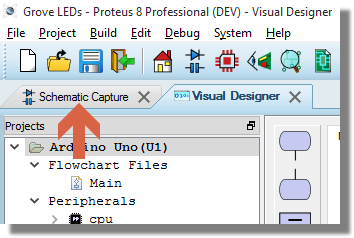
2) Place a voltage probe on the wire of interest.
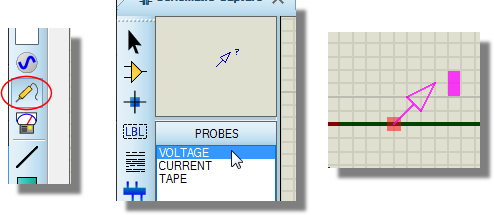
Terminals with the same name are considered connected by an invisible wire. It is a simple way to keep shields and breakouts self-contained and not have wires criss-crossing all over the screen.
3) Edit the probe and configure the Real Time Breakpoint settings.
4) Run the simulation
See Also:
Hardware Breakpoints (Proteus VSM Reference Manual)
To add a variable to the watch window
The watch window is the only debugging window available during a free running simulation. You may therefore choose to add a program variable to the watch window in order to monitor the value as the program executes. To do this:
1) With the simulation paused, open the watch window from the Debug Menu. By default, the window will dock beside the variables window.
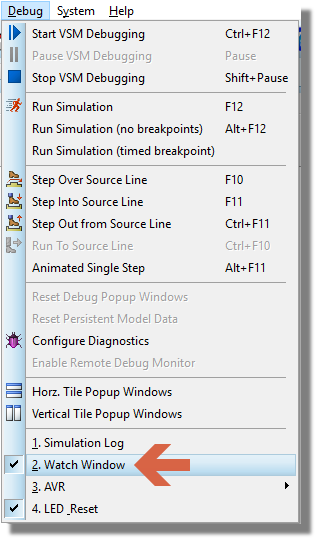
2) Switch to the variables window, right click on the variable of interest and select the 'Add to Watch Window' command.
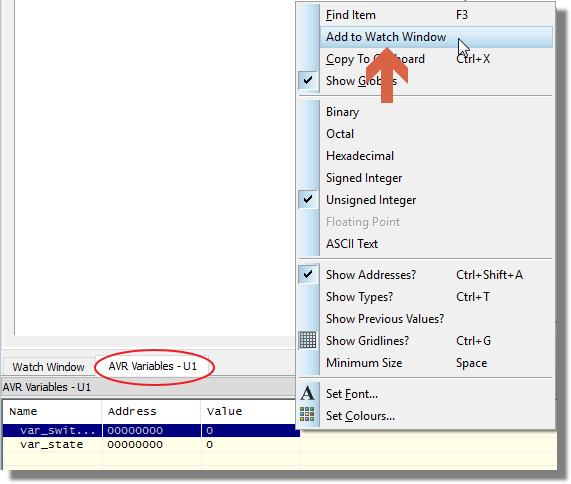
3) Switch back to the Watch Window and run the simulation.
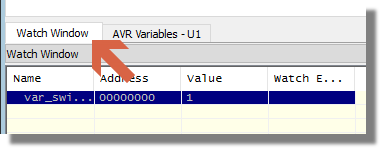
Variables are identified in the Watch Window by address. If you change your program between simulation runs there is a chance that the compiler will assign a different address to the variable and you will not be monitoring the variable on subsequent simulation runs. This can be extremely confusing and it's best to remove and re-add the variable when debugging after programming changes.
To add other items to the watch window
The watch window is simply a monitor on memory so you can add AVR registers or other program locations. For example, to add a register:
1) With the simulation paused make sure the Watch Window is open from the Debug Menu.
2) Right click on the Watch Window and select add item by name.
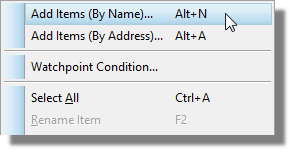
3) Select the register you want to watch and add it.
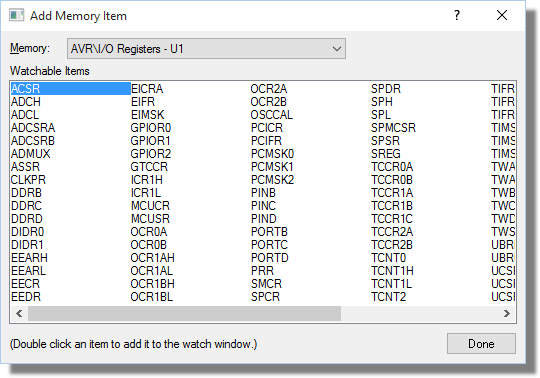
The process is very similar when adding memory locations by address.
See Also:
To set a conditional breakpoint
A conditional breakpoint (a watchpoint) is where you set a breakpoint to occur when a preset condition is met on an item in the watch window. It is often under used as a debug tool - for example, it is the perfect way to pause the simulation every time a timer overflows. To set a watchpoint condition:
1) Use the methods described above to add either a variable or a register to the watch window.
2) Right click on the item in the Watch Window and select Watchpoint Condition from the context menu.
3) Configure as required.
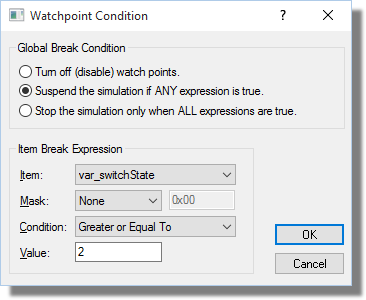
4) Run the simulation.
There is an option on the dialogue to specify whether the watchpoint is a Global Break Condition. This just determines whether the simulation suspends when any item expression is true, or only when all watchpoints are true.
To open a debug window
In addition to the source, variables and watch windows there are a host of additional debug windows that we encourage users to explore. After all, the more familiar you are with the available tools the better at finding problems you will become and the debugging toolset in Proteus is unparalleled. Often, you can even open debug windows on the shield peripheral models as well as the processor model. The process is:
1) Pause the simulation.
2) Launch the debug window you want from the Debug Menu.
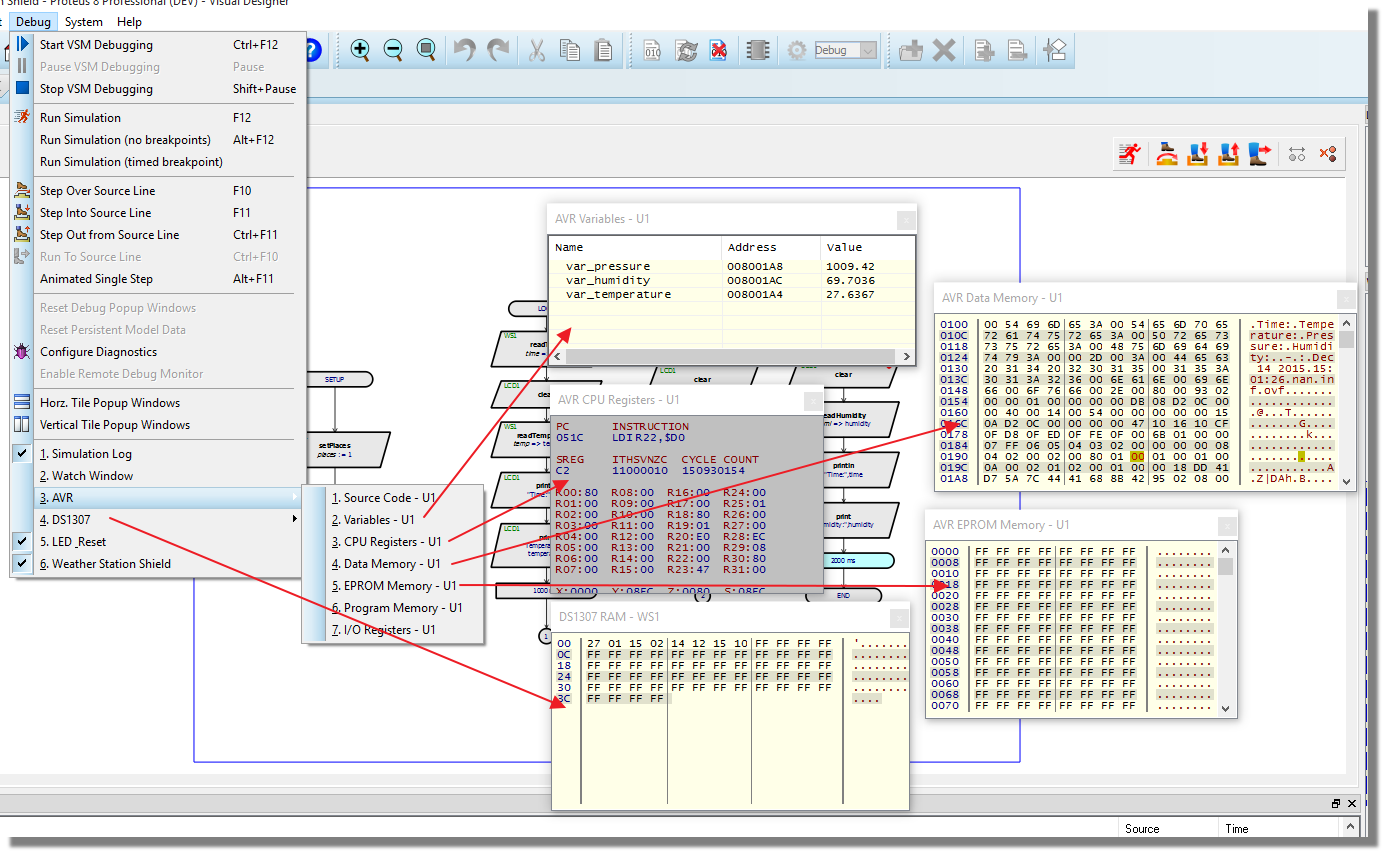
If you find yourself with a very busy screen you can close debug windows and re-open them when needed from the Debug Window. Additionally, with the exception of the Watch Window, they will all disappear during free running simulation.
Debug Console and REPL (microPython only)
When working with microPython-based projects, Visual Designer provides a dedicated debug console during simulation. This is automatically connected to a virtual internal UART, meaning it doesn’t consume any physical pins or require peripheral setup.
Any print flowchart blocks in your program will send their output here, making it a powerful tool for tracing logic and inspecting variables. Simply drop print() blocks at key points in your flowchart and monitor the output in the debug console during simulation.
In addition, the debug console supports REPL mode (Read-Evaluate-Print Loop), allowing you to enter microPython commands interactively. To enable this:
- During Simulation, press CTRL + C to exit the current running program (Not simulation).
- You need to import the Pin Variable by typing the following:
from machine import Pin
pin5 = Pin(5, Pin.OUT)
pin5.value(1) -
Begin typing REPL commands e.g.,
print("Hello")to see immediate effects on the simulated system.
REPL mode enables rapid testing, debugging, and inspection — all without editing your flowchart or restarting the simulation. This capability is unique to microPython and offers a level of interactivity not available in compiled environments like Arduino.
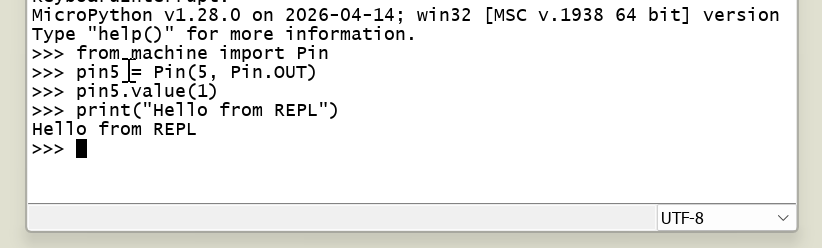
Using REPL to interactively debug a MicroPython project on the Debug Console