GUIDED TOUR
Overview
Visual Designer is a tool for designing embedded systems — including Arduino, Raspberry Pi, and microPython-based projects — via a simple flowchart interface. You can then simulate and debug the complete embedded system entirely in software.
Visual Designer Environment
Editing Layout
At design time, we are creating our embedded system, adding both hardware shields and embedded control logic. The Visual Designer Environment breaks down into six main areas as shown below
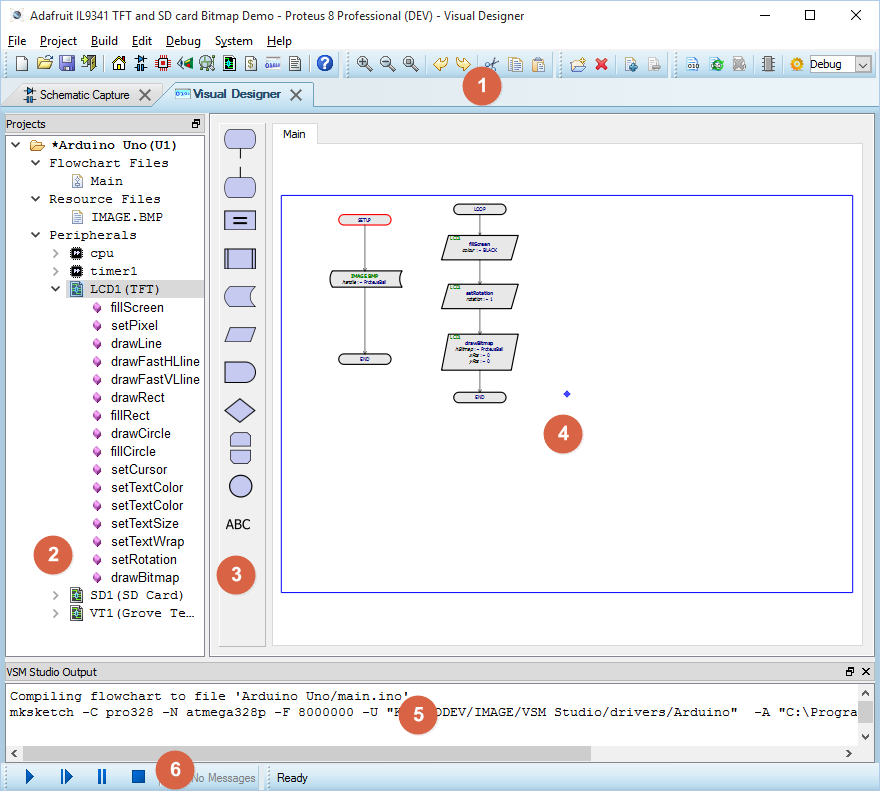
The Visual Designer IDE at Design Time.
| 1) Menus, Icons and Tabs | 2) Project Tree |
| 3) Flowchart Blocks | 4) Editing Window |
| 5) Output Window | 6) Simulation Control Panel |
Debugging Layout
During simulation and debug, the environment changes to provide relevant tools.
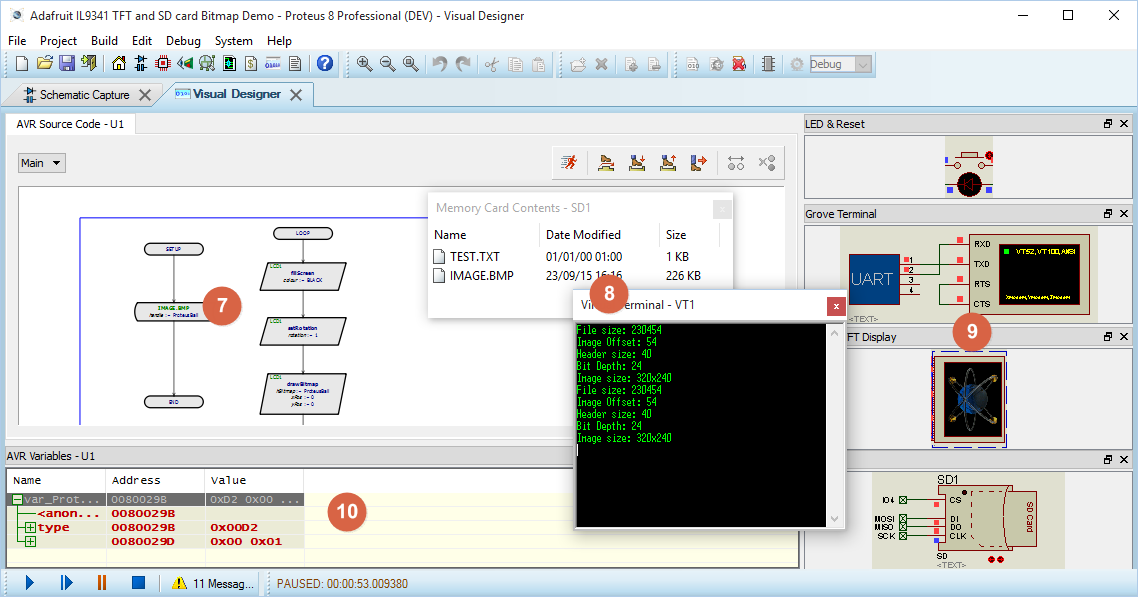
The Visual Designer IDE when single step debugging a simulation.
| 7) Source Code Window | 8) Pop-up Peripheral Windows |
| 9) Active Popups | 10) Variables Window / Debug Windows |
These items are all discussed in the following sections and are also covered in a more practical way in the tutorials.
1) Menu's, Icons and Tabs

The top menu commands will be familiar to most users and specific functionality is discussed where relevant in the tutorial and other areas of the documentation. Some of the iconography may be new however and each icon is therefore listed below along with its use:
| ICON | DESCRIPTION | ICON | DESCRIPTION | ICON | DESCRIPTION |
|
|
New Proteus Project |
|
Open VSM Studio / Visual Designer |
|
Create New Firmware Project |
|
|
Open Project |
|
Open Project Notes |
|
Delete Existing Firmware Project |
|
|
Save Project |
|
Open the Help files |
|
Add Source Files to the Existing Project |
|
|
Close Project |
|
Zoom In |
|
Remove Source Files to the Existing Project |
|
|
Open Proteus Home Page |
|
Zoom Out |
|
Build / Compile Project |
|
|
Open Schematic Capture Program |
|
Zoom All |
|
Rebuild / Compile Project |
|
|
Open the PCB Layout Program |
|
Undo |
|
Stop Build |
|
|
Open the 3D Viewer |
|
Redo |
|
Attached to IDE / Hardware |
|
|
Open the Gerber Editor |
|
Cut |
|
Project Settings |
|
|
Open the Design Explorer |
|
Copy |
|
Type of Build |
|
|
Open the Bill of Materials |
|
Paste |


The tabs allow you to switch between different areas of the Proteus Design Suite. We will be working primarily inside Visual Designer but we are building an embedded system and that creates a schematic design as well. The schematic will be automatically drawn as we add shields and peripherals to Visual Designer but you can switch to the Schematic tab at any time to look at your 'virtual hardware'. You can even drag and drop a tab onto a different monitor if you want to look at both modules simultaneously.
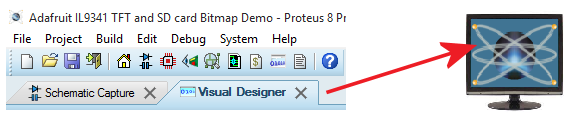
Drag and Drop Tabs onto a second monitor to split screen.
Having virtual hardware in the form of a schematic really shows its power during simulation as you can take measurements anywhere you please. You simply place and wire instruments such as oscilloscopes and logic analyzers to inspect waveforms. See the tutorial for more information and examples.
2) Project Tree
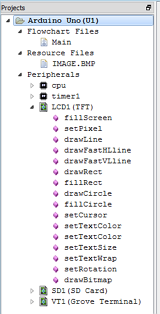
The project tree in Visual Designer performs three main roles:
- Control of Flowchart Sheets
- Control of Resources in the Embedded System
- Control of Hardware Peripherals in the Embedded System
Control of Flowchart Sheets
When you start a new project you will have by default a single sheet in the Editing Window called 'Main'. You can add more sheets (for example a subroutines sheet ) if your program is likely to become quite large.
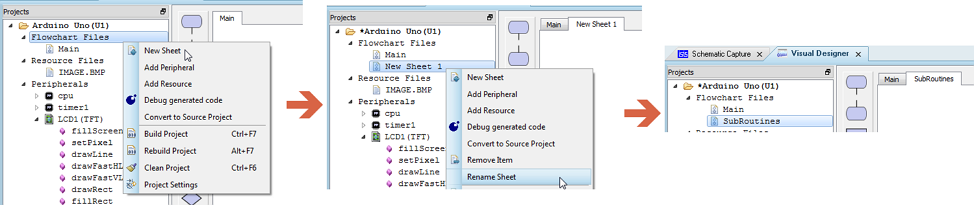
Adding and naming a second sheet in the Flowchart.
When you have more than one sheet in your project you can quickly move between sheets by double clicking on the sheet name in the Project Tree. Alternatively, you can select the sheet you wish to navigate to from the sheet tabs at the top of the Editing Window.
You can also find the sheet commands on the Project Menu at the top of the Visual Designer IDE.
Control of Resource Files
Resource files provide a great way to include pictures and audio files into your project. You can add /remove resource files from the right click context menu on the Project Tree. Once you have a resource file you can drag and drop it straight into the setup routine of your flowchart program to assign it a handle.
See Also:
Resource Files and Data Storage.
Worked Example: Bitmap Resource & TFT Display.
Control of Hardware Peripherals
Visual Designer is a development environment for a complete embedded system. The peripherals block includes on-board peripherals of the CPU and external peripherals such as Arduino shields, Grove sensors, or microPython-compatible modules. When you start a new project you will see two or three peripherals such as CPU core and Timer1 related to the processor core and you add extra peripherals via the right click context menu on the Project Tree or the command on the Project Menu.
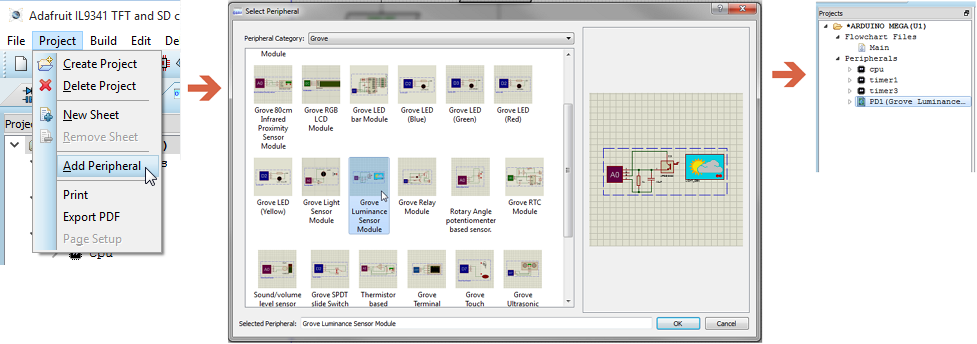
Adding a LUX sensor to the current Flowchart Project
Once added, you can see all of the methods available to you. These are the means by which you interact with the hardware and you simply drag and drop the method into your flowchart program where it will appear as an I/O Peripheral Block. This workflow is consistent across supported platforms, including Arduino, Raspberry Pi, and microPython targets — allowing you to quickly configure and control peripherals with no coding required.
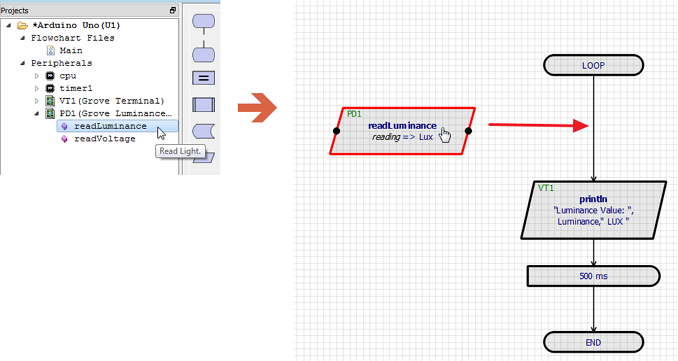
Drag and Drop the method you want straight into place in the Flowchart Editor.
You can also rename Peripherals once added. This is particularly useful for example, if you have several buttons or LED's where it is more transparent to name them according to their job. Simply right click on the peripheral and select the rename option from the resulting context menu.
See Also:
3) Flowchart Blocks
The Flowchart Blocks are the building blocks of your program. While you will often drag and drop straight from the Project Tree you can also drag and drop flowchart objects from this column onto the Editing Window. Indeed, some object types such as Delay Blocks, Loop Constructs and Event Handlers are only available from this column.
See Also:
4) Editing Window
The Editing Window is the place where you actual design your flowchart and create your programs. For programs with multiple sheets the Editing Window displays the current sheet and provides a small tabstrip at the top for easy navigation to other sheets.

Three sheets in a Visual Designer Program with the Editing Window showing the Main Sheet.
The sheet size you see is simple a set number of grid squares wide and high. Flowchart blocks and other object are then scaled to also be a set number of grid squares. You can, from the Page Setup command on the Project Menu, adjust the number of visible grid squares. This allows you to change the relative size of the flowchart blocks on the screen; for example, if you want the blocks to be bigger you reduce the number of grid squares on the screen.
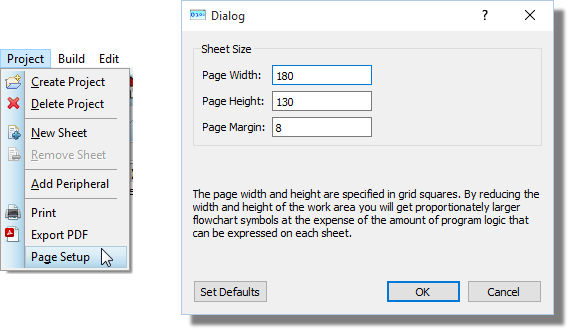
When you print to physical paper the chart will automatically fit to page.
You can place flowchart objects on the editing window by drag and drop from either the Project Tree or from the Flowchart bar on the left hand size.
You can zoom in and out the Editing Window via either the middle mouse wheel, the F6 and F7 keys or the icons on the toolbar.
See Also:
5) Output Window
The output window provides a dump of status information and will list any errors when you build your flowchart or program the physical hardware.
If you close the output window the Editing Window will be larger and you will 'zoom in' a little more on the flowchart. The output window will come back automatically when it is needed (i.e. when you build your program)
6) Simulation Control Panel
Interactive simulations are controlled from a simple panel that behaves just like a normal remote control. This control is situated at the bottom left of the screen by default. There are four buttons that you use to control your simulation.

- The PLAY button is used to start the simulator.
- The STEP button allows you to step through the animation at a defined rate. If the button is pressed and released then the simulation advances by one time step; if the button is held down then the animation advances continuously until the button is released. The single step time increment may be adjusted from the Animated Circuit Configuration dialog box on the System Menu.
- The step time capability is useful for monitoring the circuits more closely and seeing in slow motion what is affecting what.
- The PAUSE button suspends the animation which can then be resumed either by clicking the PAUSE button again, or single stepped by pressing the STEP button. The simulator will also enter the paused state if an breakpoint is encountered.
- The STOP button tells the system to stop doing a real time simulation. All animation is stopped and the simulator is unloaded from memory. All the indicators are reset to their inactive states but the actuators (switches etc.) retain their existing settings.
7) Source Code Window
The source code window is the primary tool for debugging your designs in Proteus and allows you to single step your program, advancing the entire embedded system as you debug your software. When the simulation is paused the source window will display the flowchart with the currently executing block highlighted in red.
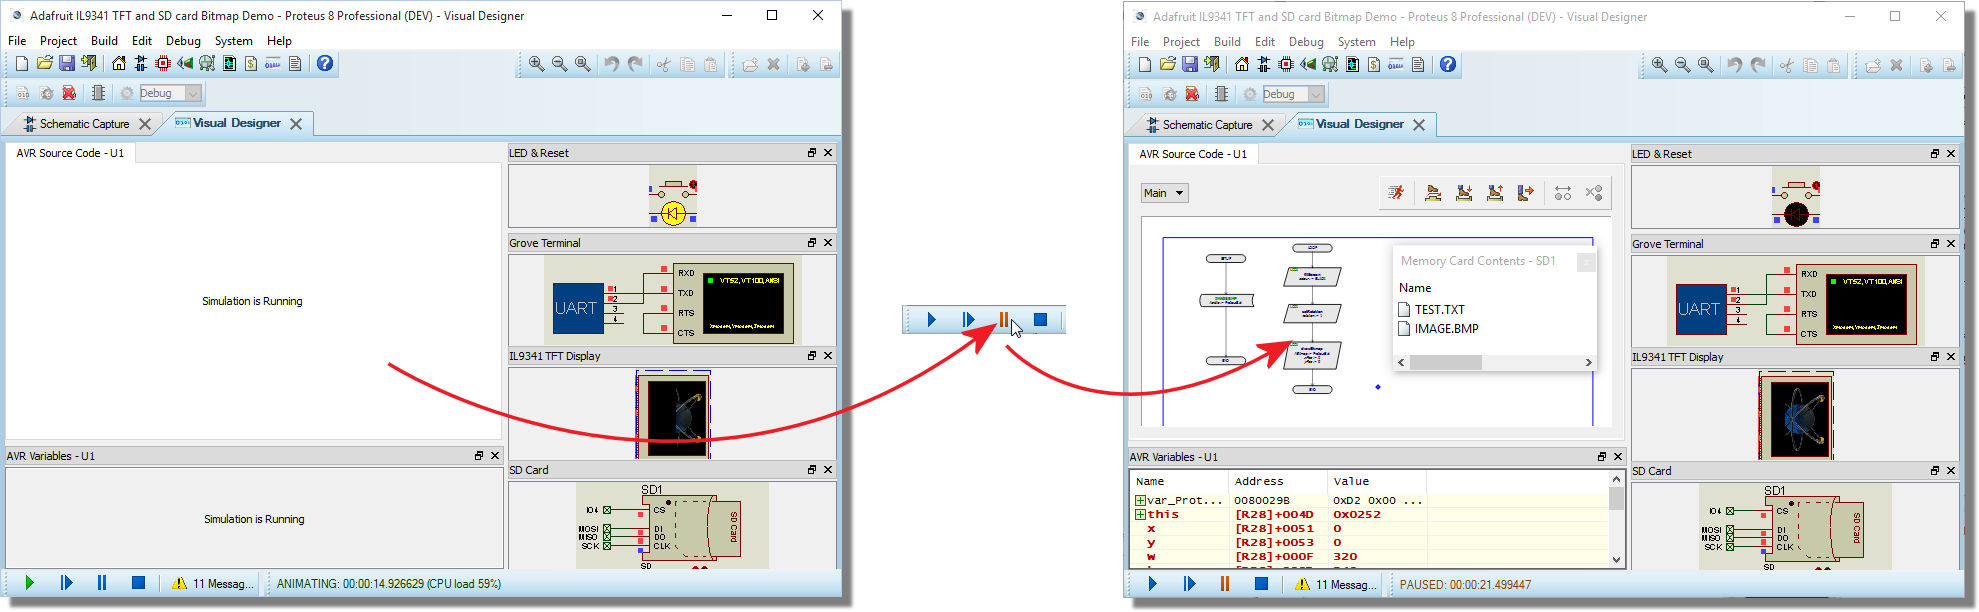
Simulation running and then displaying the program for single step debug when paused.
You can even choose to debug the source code rather than the flowchart by first selecting the Debug Generated Code option from the project tree context menu.
See Also:
Basic Skills: Simulating and Debugging
8) Peripheral Popup Windows
Some peripherals present a popup window during simulation. For example, if you add the Grove Terminal Module then you will see a virtual terminal popup during simulation that you can use to read and write text.
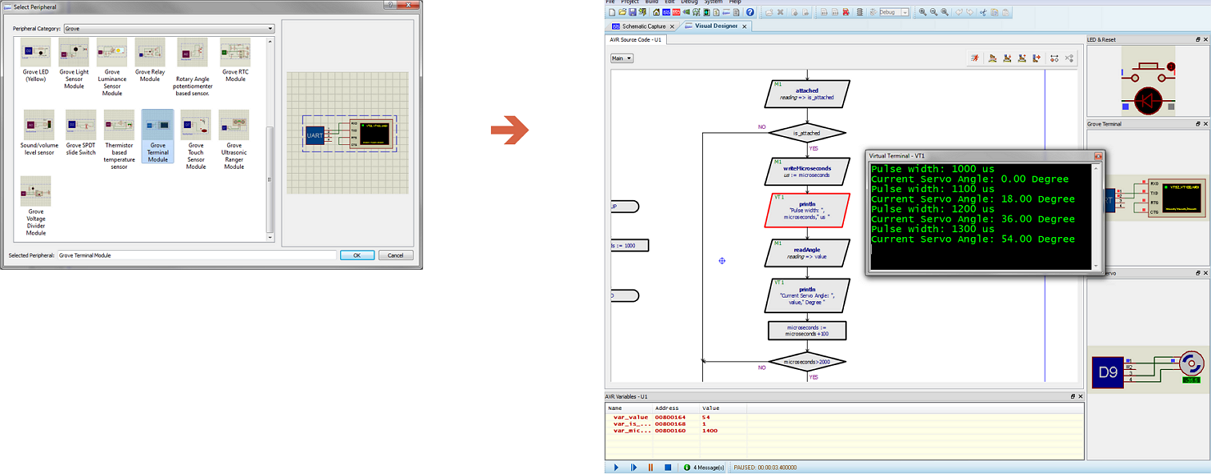
Virtual Terminal acting as a console with info dump on servo motor position.
Peripheral popups are typically visible during running simulation so that you can interact with them. They can be closed at any time from the cross at top right and then re-opened from the Debug menu when the simulation is paused.
9) Active Popups
Active popups are simply areas of interest on the schematic that appear as docked widgets on the right hand side of the of the Visual Designer debugging layout. They have two main roles :
1) You can see relevant parts of the hardware while debugging the software (E.g. text appearing on an LCD).
2) You can interact with relevant parts of the hardware while debugging the software (E.g. press a button or adjust a sensor).
The end result of using active popups is that you don't have to constantly switch tabs between the schematic and the firmware in a debug session. They allow all relevant information to be displayed on a single tab.
You can, if you prefer, work with two tabs and switch between schematic and Visual Designer as required. You can even drag and drop into space if you are at a workstation with multiple monitors.
10) Variables Window
The variables window is a debugging tool that lists program variables during a debug session. It includes several powerful features to help you when debugging.
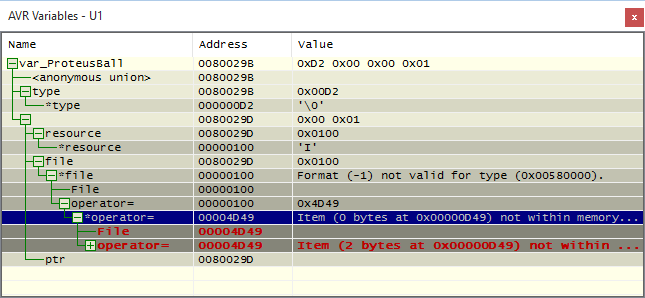
Expansion of compound types
The variables window will seamlessly handle compound types (structs, arrays, enums) and pointers, providing an expandable tree displaying the contents of the type or the de-referencing of the pointer.
Change Notification and Previous Values
A variable in the variables window will highlight when the value of that variable changes and the simulation is paused. You can also view the previous value of the variable by selecting the Show Previous Values option from the context menu (right click on the variables window).
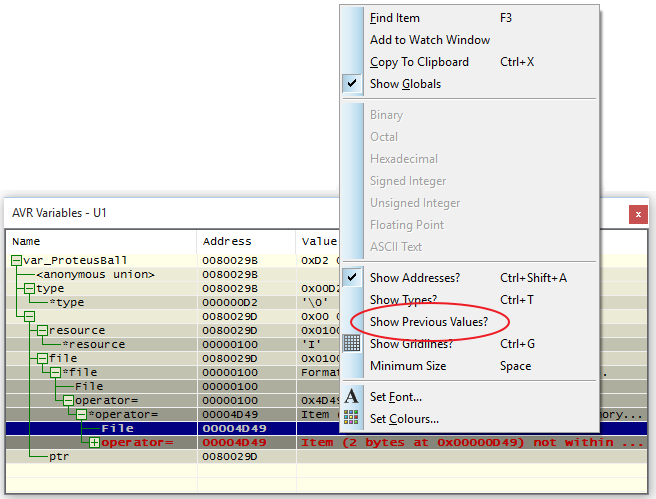
If you have a compound type (such as a struct) and an element of the type changes then only that element will highlight. This means that, unless the type is expanded, you will not see a change in the variables window at the point the element changes.
Add to Watch Window
The variables window is not visible during free running simulation but it's companion the Watch Window is. You can add a variable to the watch window by the right click context menu and you can then open the watch window from the Debug Menu.
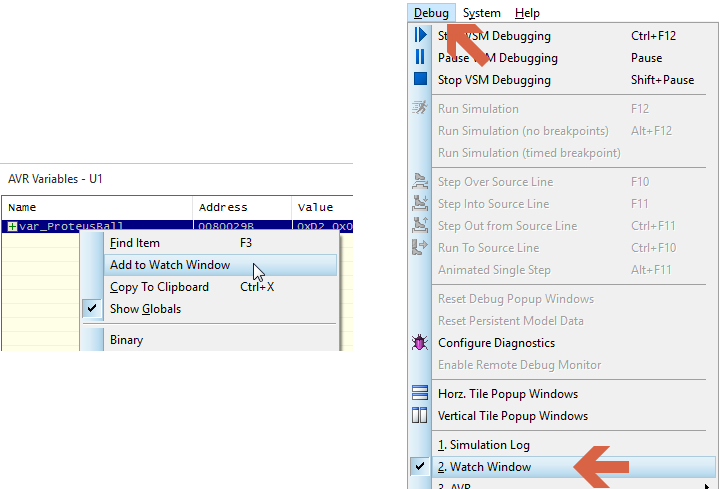
If you drag a variable to the watch window and you then recompile the program and re-simulate then there is no guarantee that you will be viewing the contents of the variable in the watch window – this depends on how the compiler re-uses memory. The watch window simply monitors an address in memory. Be careful.
In addition to the Variables and Watch Windows there are many more available debug windows which provide more detailed information about the MCU. These can all be launched from the Debug Menu when the simulation is paused and are documented in full in the Proteus VSM help files.
Colours, Fonts and Flowcart Editor
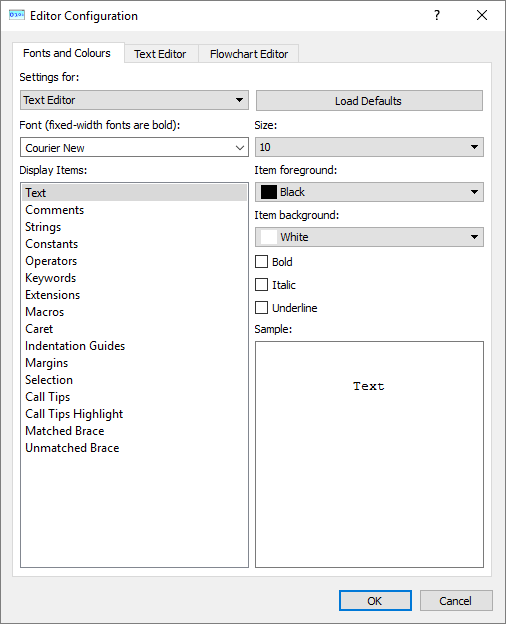
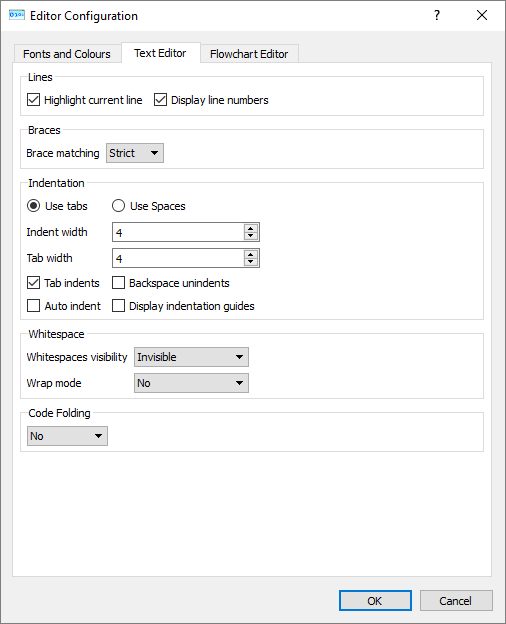
In Visual Designer you can edit the fonts, colours and the style of the Flowchart editor to your own preference. To open the dialog go to the System Menu > Editor Configuration
Fonts and Colours
Text Editor
Flowchart Editor