SETTING UP GRAPH BASED SIMULATION
Overview
Graph based simulation involves five main stages. These are summarised below, with detailed explanations of each stage being given in the subsequent sections:
- Entering the circuit to be simulated.
- Placing signal generators at points that require stimulus and test probes at points that you wish to inspect.
- Placing a graph corresponding with the type of the analysis you wish to perform, for example a frequency graph to display a frequency analysis.
- Adding the signal generators and test probes to the graph in order to display the data they generate/record.
- Setting up the simulation parameters (such as the run time) and executing the simulation.
Entering The Circuit
Entering the circuit you want to simulate is exactly the same as entering any other design on the schematic; the techniques for this are covered in detail in the Schematic Capture manual.
Placing Probes and Generators
The second stage of the simulation process is to set up signal generators at points that require stimuli and probes at points of interest. Setting up signal generators and probes is easy, as they are treated like other schematic objects such as components, terminals, or junction dots. All that is required is to select the appropriate icon, pick the type of generator or probe object from the selector, and place it on the schematic where you want it. This can be either by placing it directly on to an existing wire, or by placing it like a component and then wiring to it later. Defining the signal produced by a generator is then just a matter of editing the object and entering the required settings on its dialogue form.
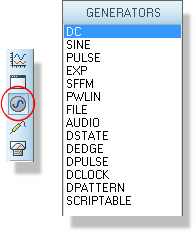
Placing a generator on the schematic
At this stage you can also isolate a section of the design so that only certain components are involved in the simulation. A generator can be set to isolate the circuitry before it, using its Isolate Before? option. A voltage probe can be set to isolate the circuitry after it, using its Isolate after? option. The use of probes and generators in this way provides not only for faster simulations, but also means that errors do not creep in from removed wires being forgotten and never replaced.
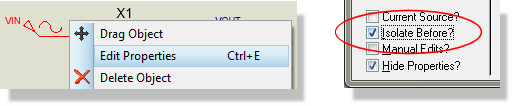
Configuring a generator to isolate from preceding circuitry.
Placing Graphs
The third stage of the simulation process is to define what analysis type or types you want performed. Analysis types include analogue and digital transient analyses, frequency analyses, sweep analyses and others. On the schematic, defining an analysis type is synonymous with placing a graph object of the required analysis type. Again, as graphs are just like most other objects on the schematic, placing one is simply a case of selecting the correct icon, selecting the required graph type, and placing the graph on the design, alongside the circuit. Each graph type is described in the Analysis Types chapter. Not only does this allow you to view several types of analysis simultaneously, it fits very well with the 'drag-and-drop' methodology adopted throughout the schematic editor and has the added benefit that you can view (and generate hard-copy output with) the graphs alongside the circuit that generated them.
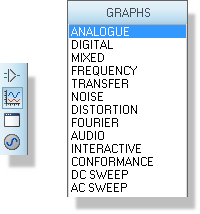
Preparing to place a graph on the schematic
Adding Traces To Graphs
Having placed one or more graph objects, you must now specify which probe/generator data you want to see on which graphs. Each graph displays a number of traces. The data for a trace is generally derived from a single probe or generator. However, a trace can display the data from up to four separate probes/generators combined by a mathematical Trace Expression. For example, a trace might be set up to display the product of the data from a voltage probe and current probe (both monitoring the same point) so effectively displaying the power at the monitored point.
Specifying the traces to be displayed on a graph can be done in a number of ways: you can tag-and-drag a probe onto a graph, or you can tag several probes/generators and add them all to a graph in a single operation, or, for traces requiring trace expressions, you must use a dialogue form to select the probes and specify the expression. All three methods are described in Adding Traces To A Graph. An existing trace, including its expression, is changed on the Edit Graph Trace dialogue form.
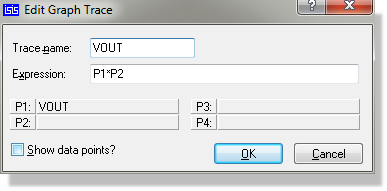
Editing a trace expression
The Simulation Process
Graph based simulation is Demand Driven. This means that the emphasis is on setting up generators, probes and graphs in order to determine what you want to measure, rather than on setting up the simulator and then running some kind of post processor in order to examine the results. Any parameters that are specific to a given simulation run are specified by either editing the explicit properties of the graph itself (e.g. the start and stop times for the simulation run) or by assigning additional properties to the graph (e.g. for a digital simulation, you can pass a 'randomise time delays' property to the simulator).
For an account of what happens once you have initiated a simulation, see What Happens When You Press the Space-Bar.
See Also: