DIAGNOSTIC TOOLS
Overview
Proteus VSM includes extensive support for diagnostic tools or trace modes, which are invaluable in fault finding and verifying system operation. This is a mechanism by which all activity, or specified activity, is logged during simulation and displayed in the Simulation Log. Think of it as a way to 'lift the lid' on a part and examine internal behaviour, providing traceability of data through the part and across the system.
Being a system level simulator, Proteus VSM includes diagnostic modes not only for microcontrollers but also for appropriate peripheral models (LCD displays, I2C memories, temperature control devices and so on) and these trace modes can be enabled granularly from the Configure Diagnostics dialogue form.
Configuring Diagnostics
To configure a simulation with diagnostics enabled:
- Right click the part you are interested in and select
Configure Diagnostics from its context menu. This opens the dialogue
form with the tree already scoped to that part, which saves hunting
for it. To reach every part in the design at once, select Configure
Diagnostics from the Debug menu instead.
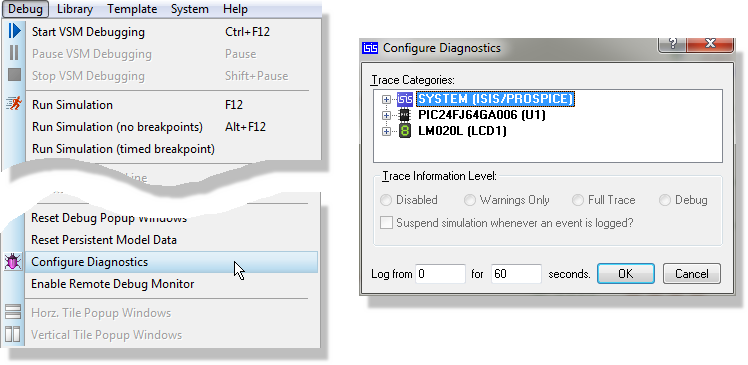
- Expand the trees in the dialogue form to find the
item(s) for which you wish to enable diagnostics.
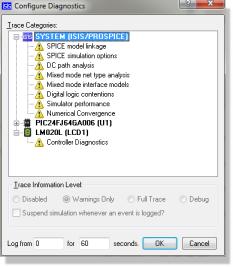
- Left click on the item of interest to select it and
then set its Trace Information Level. There are four: Disabled records
nothing, Warnings Only records just the things that look wrong, Full
Trace records everything the model reports, and Debug adds the model
author's own internal detail on top of that.
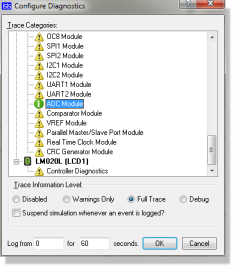
- If you only want diagnostics over part of the run, use the Log from and for ... seconds fields to set the time at which logging starts and how long it lasts.
- Repeat the process for any other items of interest and then exit the dialogue form.
When you run the simulation the configured trace diagnostics will become active at the time you set, run for the specified period, and all results will be displayed in the Simulation Log.
The dialogue form also carries a Suspend simulation whenever an event is logged? checkbox. This is effectively a soft breakpoint on any diagnostic message: the simulation stops the moment the traced part has something to say, leaving the whole design frozen for you to inspect. It is one of the quickest ways to catch an intermittent problem.
Note that enabling trace diagnostics imposes a considerable load on the simulation. However, as they are typically used to identify obscure problems and for debugging purposes, the fact that the simulation will not run in real time is not an issue.
The Simulation Log
The Simulation Log is the repository for all error, warning and diagnostic messages generated during a simulation run. Its indicator sits at the right hand end of the Animation Control Panel itself. During a simulation run it live updates, showing the number of messages logged and an icon for the most severe of them. Click it to open the log, at any time during a simulation or after the run has finished.
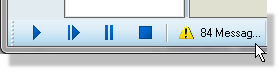
Opening the Simulation Log from the Animation Control Panel
- If you are working with the VSM Studio IDE then the Simulation Log will appear as a docked tab in the IDE screen during simulation.
- If you are working directly on the schematic then the Simulation Log will appear as a floating window during simulation, and can be docked at the bottom of the window if you prefer.
- If no simulation is running the Simulation Log will open as a separate tab, which can then be moved into another frame if desired.
The log holds a Message column, a Source column and, where the message carries one, a Time column. Every message has a severity indicator beside it. Messages come in seven severities, from information, trace and data output through warnings and errors to fatal errors and exceptions; the indicator on the Animation Control Panel collapses these into three, so you can tell at a glance whether anything needs your attention. Where the message allows it, the log also offers navigation, both to a net and to a component on the schematic, and context sensitive help on common errors.
The Multimeter and Scope buttons sit on the Animation Control Panel alongside the log indicator, and open the System Meter and System Scope. Both keep running while the simulation does, so they pair naturally with the log when you are chasing a problem down.
Navigation to a Device from the Simulation Log
All messages originating from a physical component (pretty much everything except system messages) have an associated Source column at the right hand side of the message. This indicates the component on the schematic which generated the message, and left clicking the mouse on the source link will minimise the Simulation Log and both zoom to and tag the source component.
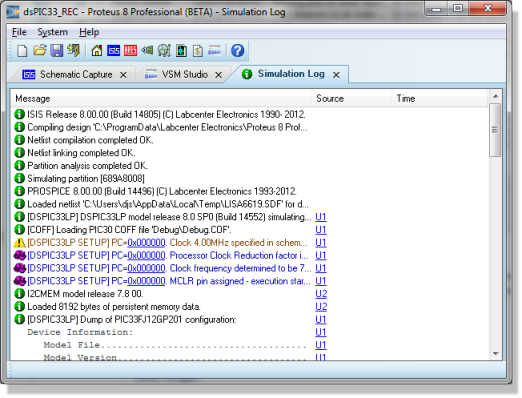
Navigating to a message source in the Simulation Log
This is extremely useful, particularly in more complex designs, where you want to examine the hardware design around a device to resolve a problem.
Navigation to a Net from the Simulation Log
One of the most frustrating things about simulation errors is that some problems (net contentions, SPICE singular matrices and the like) are relevant to a net and not a specific component, and it is therefore extremely awkward to isolate the offending circuitry on the schematic. The Simulation Log simplifies this task by including 'hyperlinks' where applicable on messages, which when clicked allow you to navigate the design.
To navigate to a net from the Simulation Log:
- Click on the 'net link' contained in the message
of interest within the Simulation Log.
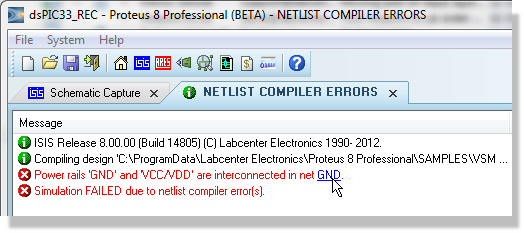
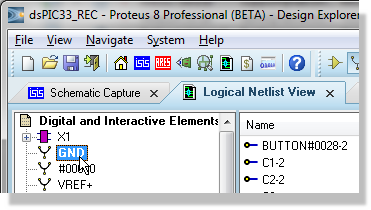
- This will minimise the Simulation Log and launch
the Design Explorer, showing you a list of nets on the left hand pane
and all the connections (pins) on the offending net in the right hand
pane.
- Right click on one of these pins and select the Goto
Schematic Net option from the resulting context menu.
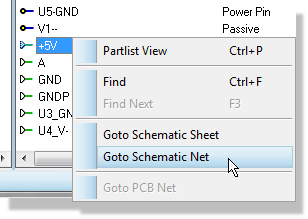
- The net in question will now be highlighted on the
schematic. As we can see this is an error where +5V should not be connected
to GND.
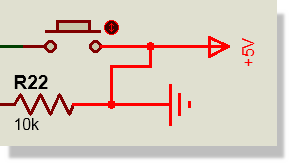
Note that this method is not foolproof. Where a schematic part is modelled via equivalent circuits (that is, the functionality of the part is modelled in schematic form by wiring together parts which already have models) and the problem net exists within the model, it is not possible to navigate to the net. However, while this and other parasitic cases exist, the technique above will work in almost all normal situations and provides a powerful analysis tool in such cases.
The Design Explorer is discussed in detail both in the schematic tutorial and in the Design Explorer reference manual.
Context Sensitive Help in the Simulation Log
Error messages which indicate common mistakes and/or design flaws include context sensitive help which details recommended solutions to the issue. This provides you not only with a clear indication of what has gone wrong but also with relevant suggestions for resolving the issue. You can open the help topic for such a message simply by left clicking the mouse on the help icon at the right of the message, as shown below:
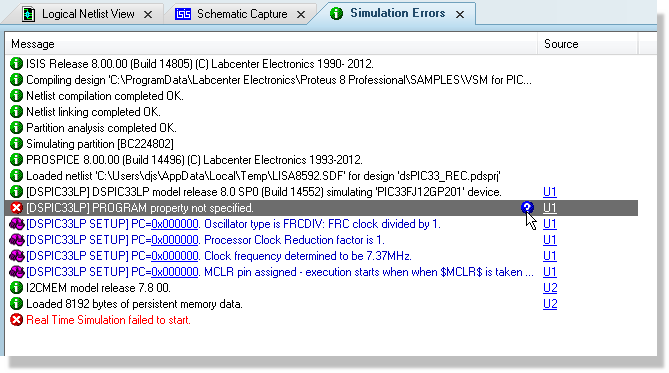
Using context sensitive help in the Simulation Log
The Context Menu
Right clicking on the Simulation Log window produces a context menu with Copy to Clipboard and Select All for taking the contents elsewhere, Show Gridlines?, Set Font... and Set Colours... for the appearance of the window, and Clear.
Messages are otherwise persistent: they stay in the log after the run has finished, and are still there when you open it later. Clear is the one thing that removes them, which makes it useful before a run you want to read cleanly, and worth avoiding afterwards.
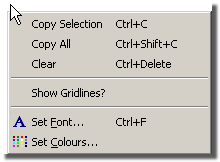
The Simulation Log context menu
Where the AI assistant is available, the Simulation Log can be attached to it from the assistant's attachment menu, so that you can ask it to explain what the log is telling you.
See Also: