GUIDED TOUR
Overview
VSM Studio should look familiar to most users who have previous experience with writing code in an IDE. It is a top level application module and can be opened at any time from the application module toolbar.

The module is a convenience rather than a requirement. Firmware built in another IDE can be attached to the processor on the schematic and simulated without VSM Studio being involved at all, but for small and medium projects it is the quickest route from source code to a running simulation.
This module is used for both firmware development and for firmware debugging. There are therefore two layout profiles, depending on the mode of operation.
Editing Layout
The Editing Layout has three main areas:
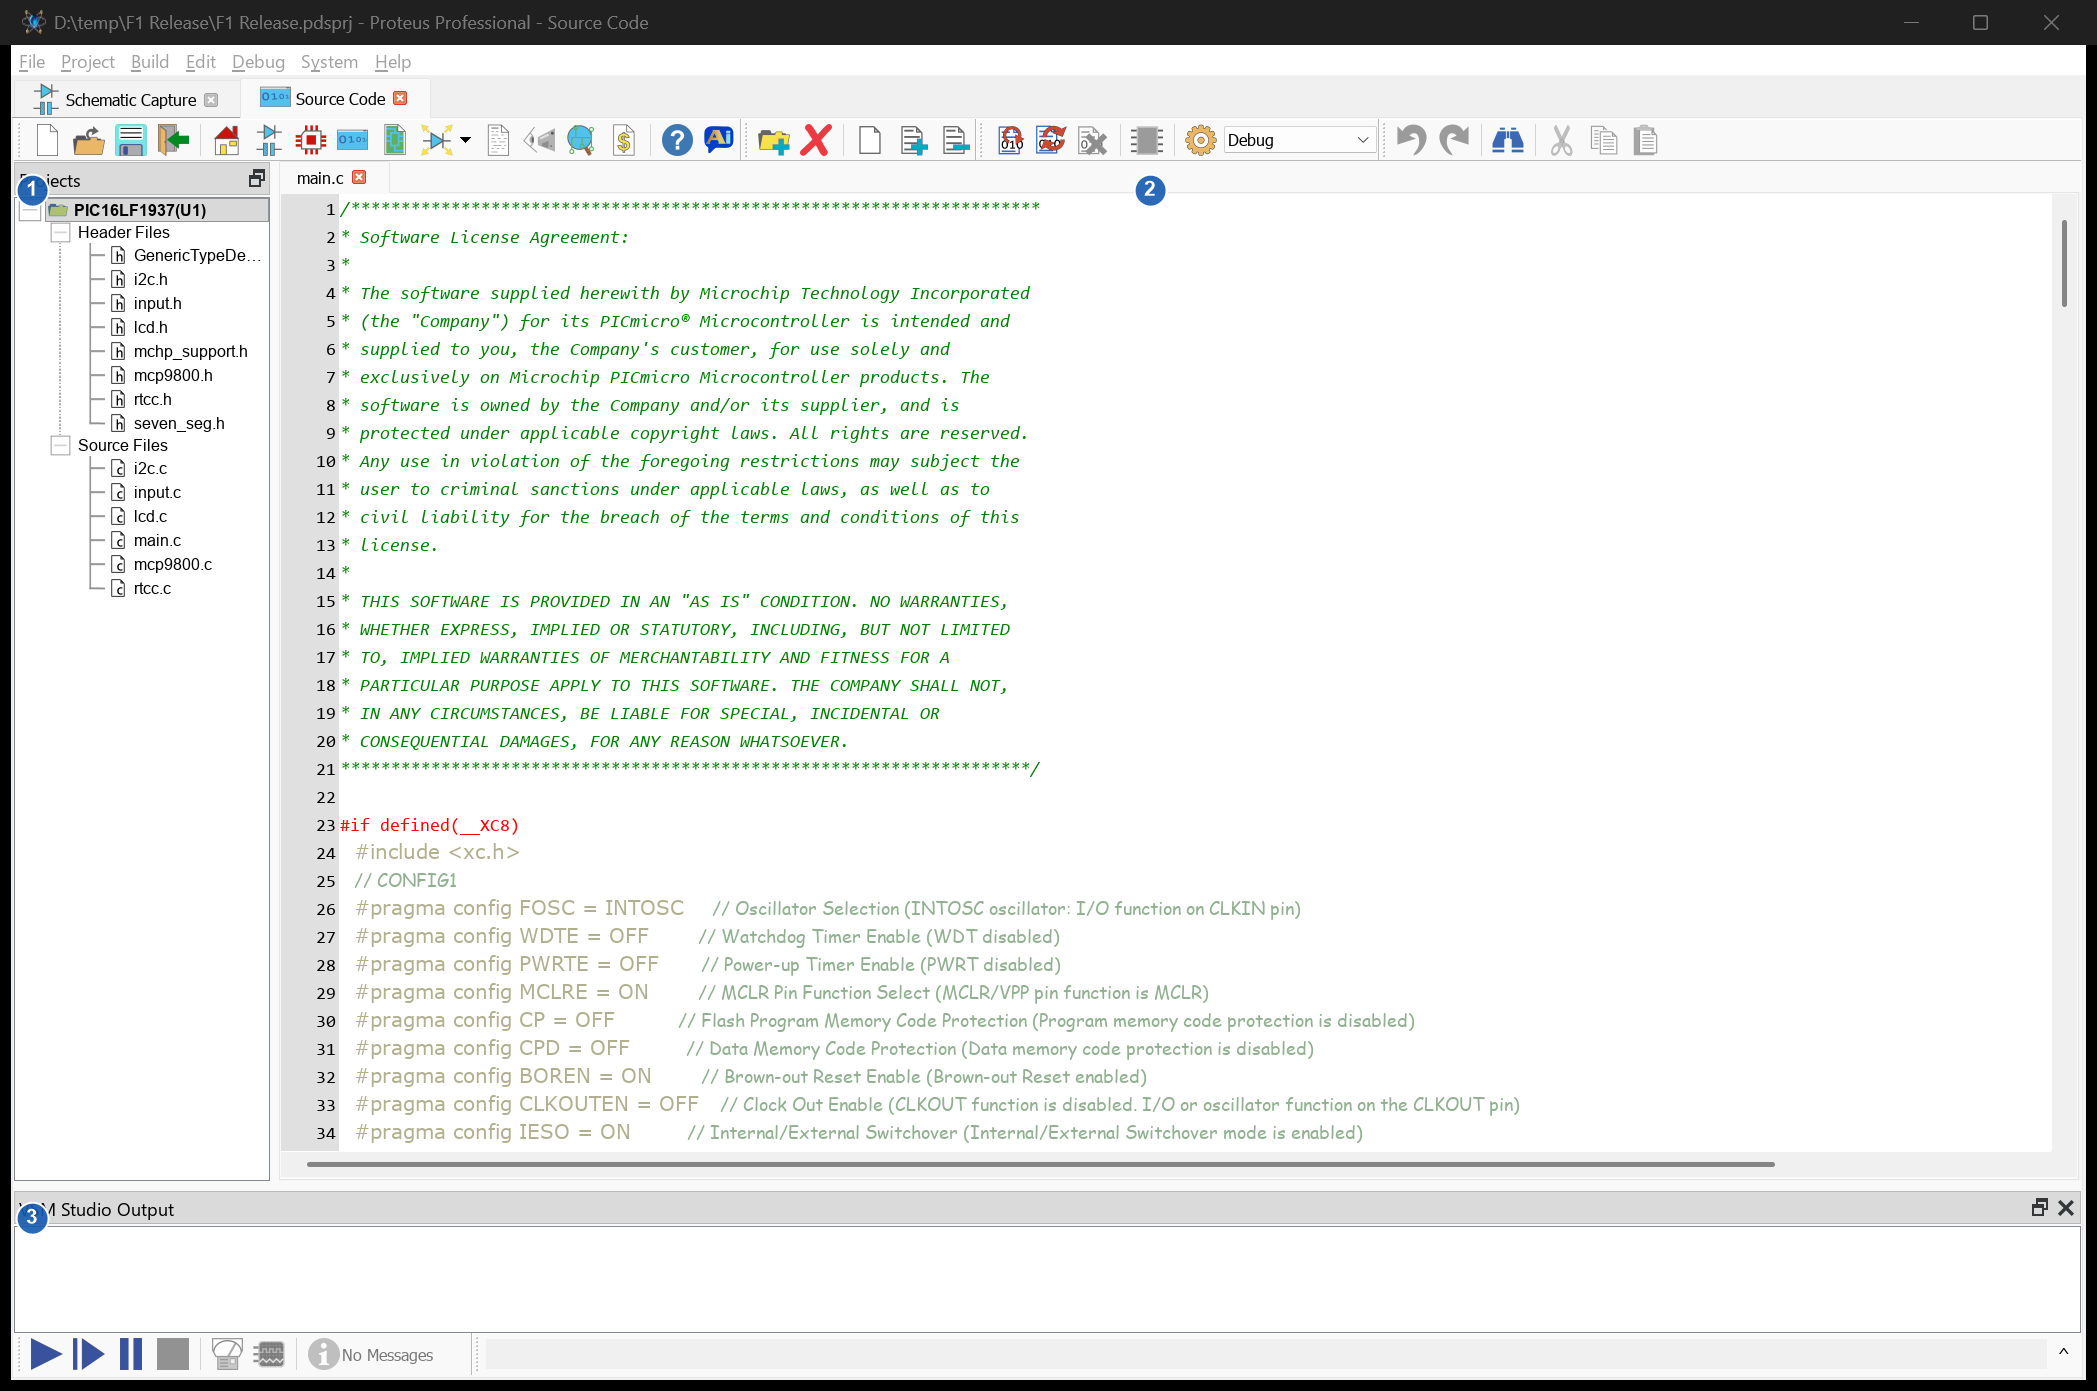
Project Tree
The project tree contains a sorted list of the files in the current project. This can include source files, header files, library files and include files.
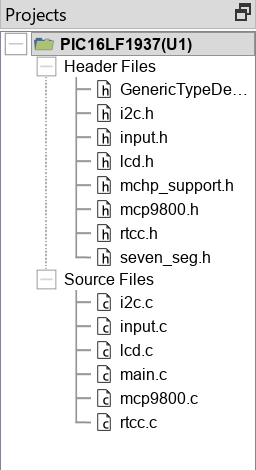
View of the Project Tree with an Open Project.
- Double clicking on a file in the Project Tree will open the file in the Editing Window.
- Right clicking on a file presents a context menu which, amongst other things, allows you to remove the file from the project.
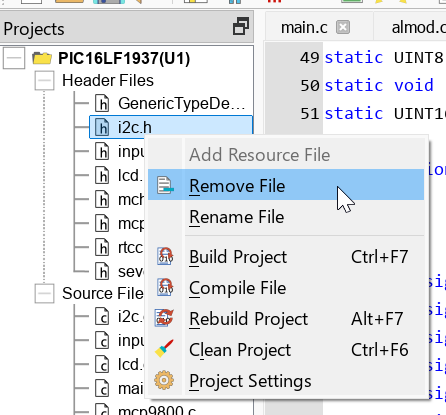
Context Menu on File
- Right clicking on a category (e.g. Source Files) presents a different context menu which allows you to add either new or existing files to that category of the project.
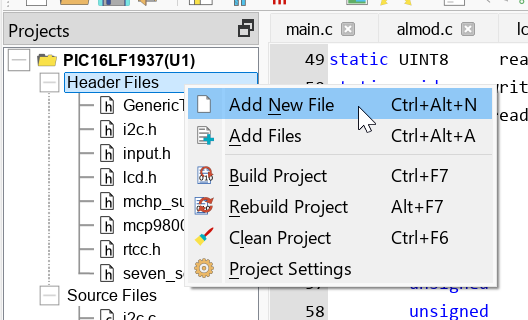
Context Menu on File Category.
You can also add and remove files from the project directly from the Project Menu, using the Add New File, Add Files and Remove File commands.
Editing Window
The editing window is where all the source files open for viewing and editing. If you have multiple files open at one time each file will become a tab on the editing window.

Multiple Tabs for Opened Files in the Editing Window.
You can switch between tabs by clicking on the tab you wish to view. Closing a file from the Editing Window (via the cross at the right hand side of the tab) removes the file from the Editing Window but not from the Project Tree.
When writing or editing firmware you will find most common editing commands directly on the right click context menu. These commands are also available from the Edit Menu.
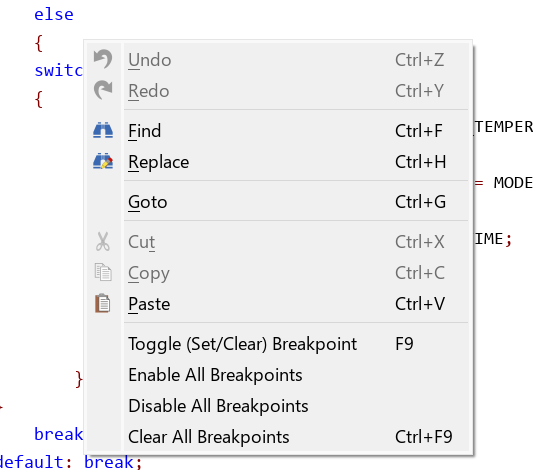
Editing Window Context Menu.
Output Window
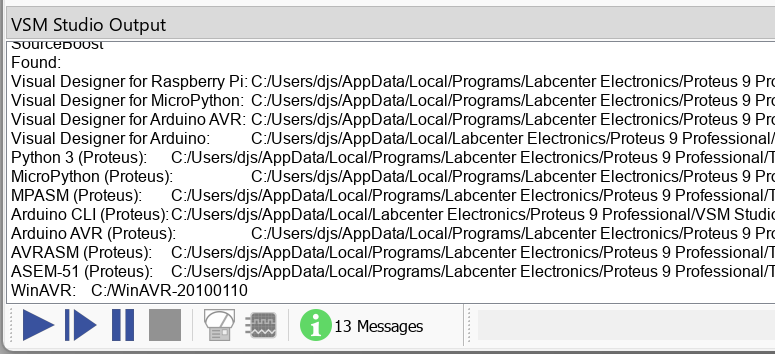
The Output Window will display the result of project compilation as well as additional information and prompts.

Output Window Display after Compilation.
It will also display detection and configuration status when you check for installed compilers.
See Also:
VSM Studio Tutorial - Writing the Program
Additional Windows
Three further windows are available alongside the three main areas.
The System Terminal is a serial terminal. The controls along the top of the window select the COM port, the baud rate and the data format, and the terminal then displays whatever arrives on that port and sends whatever you type back to it. This gives you a console for target boards that communicate over a serial connection. The window is docked as a tab alongside the Output Window and is hidden until you open it with the System Terminal command on the Debug Menu.
The Properties window is docked below the Project Tree and appears only when the project has a hardware configuration, an Arduino project with peripherals in the project tree for example. Selecting an item in the project tree displays its properties here for editing.
The Breakpoints window lists every breakpoint in the project, giving the file, the address and the owning project for each one, and lets you enable, disable or clear them without hunting through the source files. It is docked as a tab alongside the Output Window and is hidden until you open it with the Breakpoints command on the Edit Menu or the SHIFT+F9 keyboard shortcut.
Debugging Layout
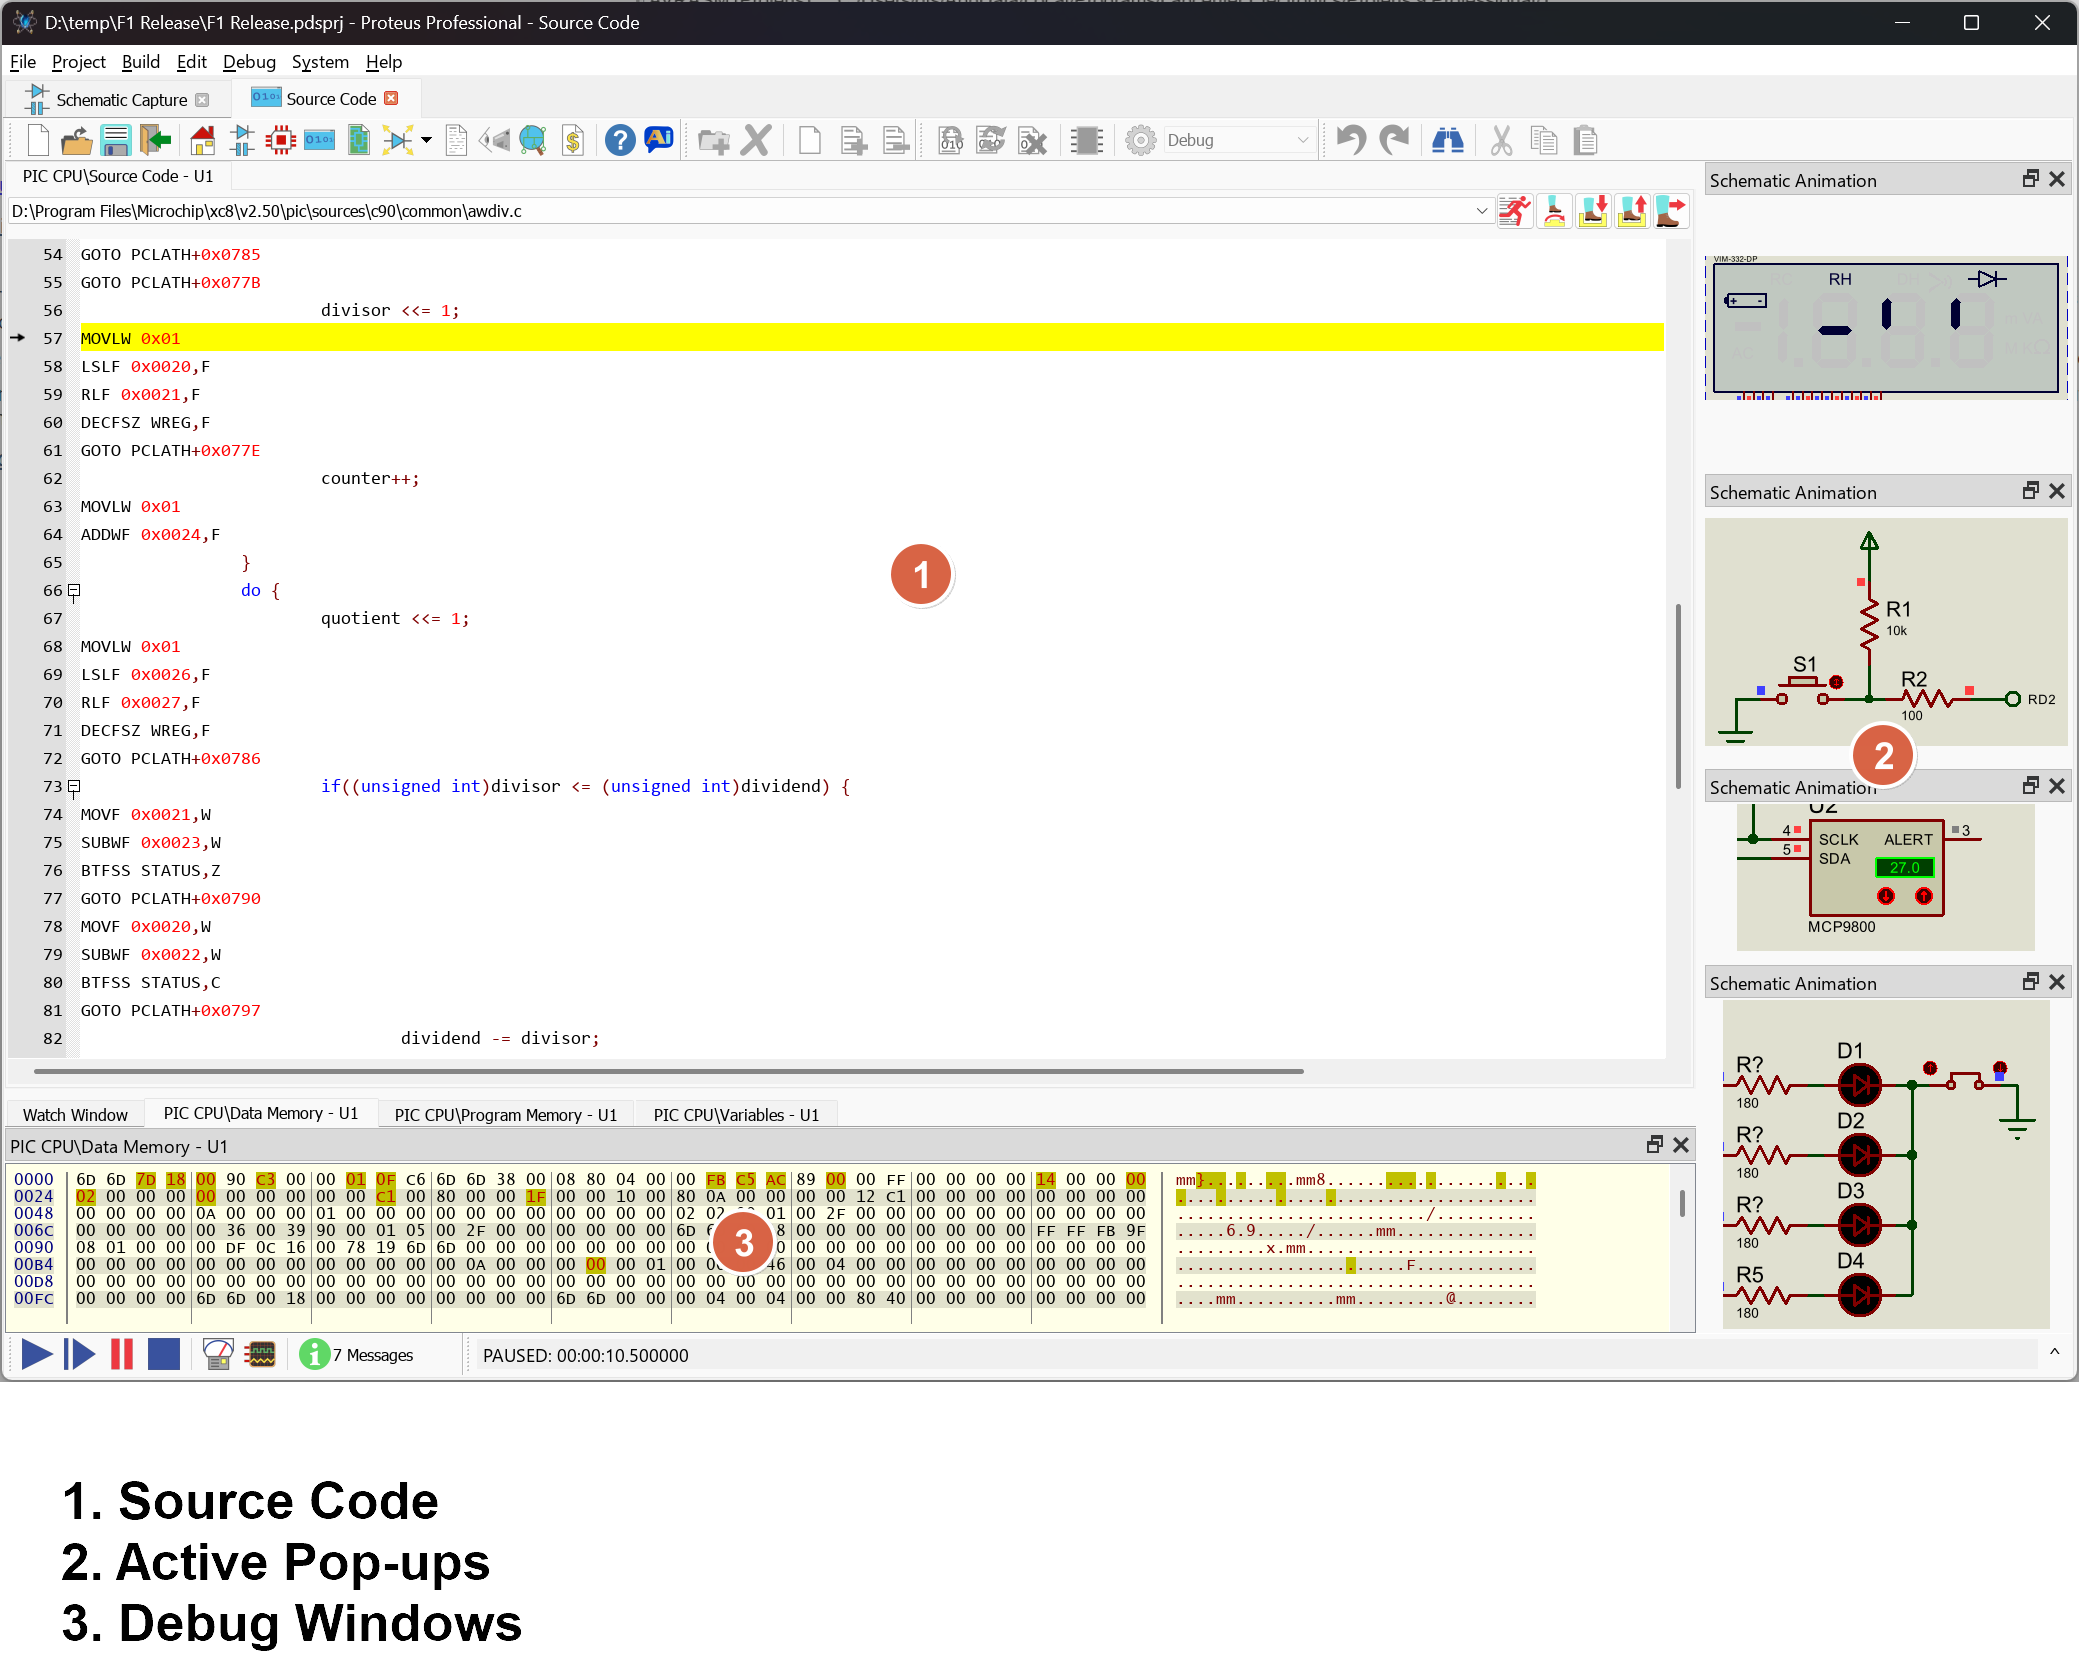
Source Code Display
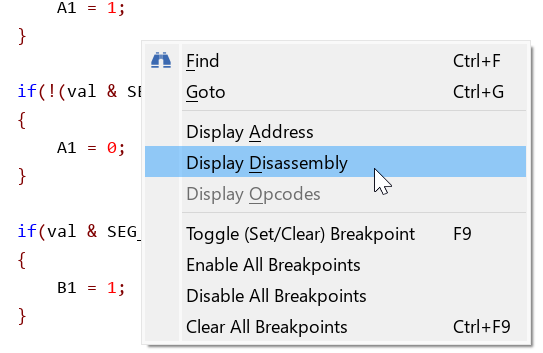
Source code is displayed when the simulation is paused, either manually or when a breakpoint has been reached. From here, you can then:
- Navigate the source file or select a different source file from the combo box at the top

- Single step debug or set breakpoints either from the icon strip or via keyboard shortcut commands.
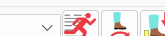
- Change the level of debugging to and from assembler and high level source.
See Also:
VSM Studio Tutorial : Simulation and Debugging
Active Popup Panel
If you define any active popups on the schematic they will (by default) appear docked on the right hand side when the simulation is running.
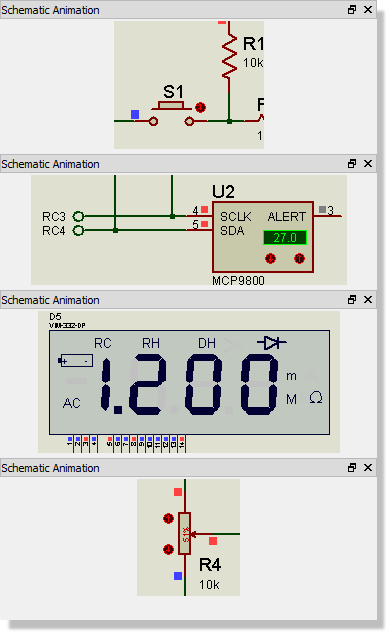
Active popups are both visual and interactive. You can click on a button or flick a switch in an active popup in exactly the same way as you would on the full schematic.
See Also:
VSM Studio Tutorial : Active Popups
An assumption is made when you define an active popup that your primary interest is debugging the firmware and not the hardware. You will find therefore that the VSM Studio tab will automatically come to the foreground when a simulation is started. If you have no active popups defined on the schematic then the schematic tab will come to the foreground when you start a simulation.
Debugging Windows
Proteus contains a large number of memory dump windows, watch windows, register and stack displays which can all be launched from the Debug Menu in VSM Studio.
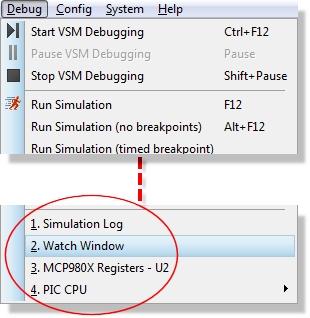
When you open a debug window it will appear docked at the bottom of the VSM Studio frame. The memory, register and variable windows do not update while the simulation is free running, since the processor is executing far too quickly for the display to be readable; they show the state of the processor as soon as the simulation is paused or single step debugged.
Several windows do work live throughout a run. The Watch Window refreshes continuously, so it is the place to put the handful of values you want to follow at full speed. The Simulation Log accumulates messages as the models issue them. The System Scope and the System Meter display the signals they are probing as the simulation progresses.
The System Scope and the System Meter are launched from the Scope and Multimeter buttons on the animation control panel at the foot of the frame. Like the other debug windows they dock at the bottom of VSM Studio, so you can watch a waveform or take a measurement on the hardware without leaving the firmware debugging environment.
See the System Meter topic for full coverage of the system instruments.
See Debug Windows for more on working with the debugging windows.
Toolbar
The toolbar in VSM Studio provides quick access to a number of frequently used commands, most of which will be easily recognisable to users.

VSM Studio Toolbar.
The Build toolbar also carries a combo box listing the build configurations defined for the project. Whichever configuration is selected here is the one used when you build, so this is where you switch between a debug build and a release build. Selecting the Configurations entry at the end of the list opens the Build Configurations dialogue, where the set of configurations can be created and edited.
See the Icon Reference Chart for a description of each icon.
See the section on Debugging for more information on using VSM Studio with Proteus VSM.
Window Positioning and Styling
The various windows in both the editing and the debugging layout can all be sized and positioned using standard techniques:
- Dragging and dropping from the grey title bar of the window allows you to reposition.
- Double clicking on the grey title bar or single clicking on the double rectangle icon will allow the window to float.
- Double clicking on the grey title bar while a window is floating will dock the window in its previous location. Alternatively you can drag a floating window to a new docked position.
- The output window can be closed completely either via the cross at the right hand side of its title bar or by right clicking on the toolbar as described above.
- The Project Tree and Output Window can both be resized by dragging and dropping the edge of the windows.
Styling and colours of the various windows can be modified via the Editor Configuration command on the System Menu (each tab has its own reference page: Fonts and Colours, Text Editor and Flowchart Editor). The dialogue has three tabs: Fonts and Colours, Text Editor and Flowchart Editor.
First select the Fonts and Colours tab and choose which window you wish to configure.
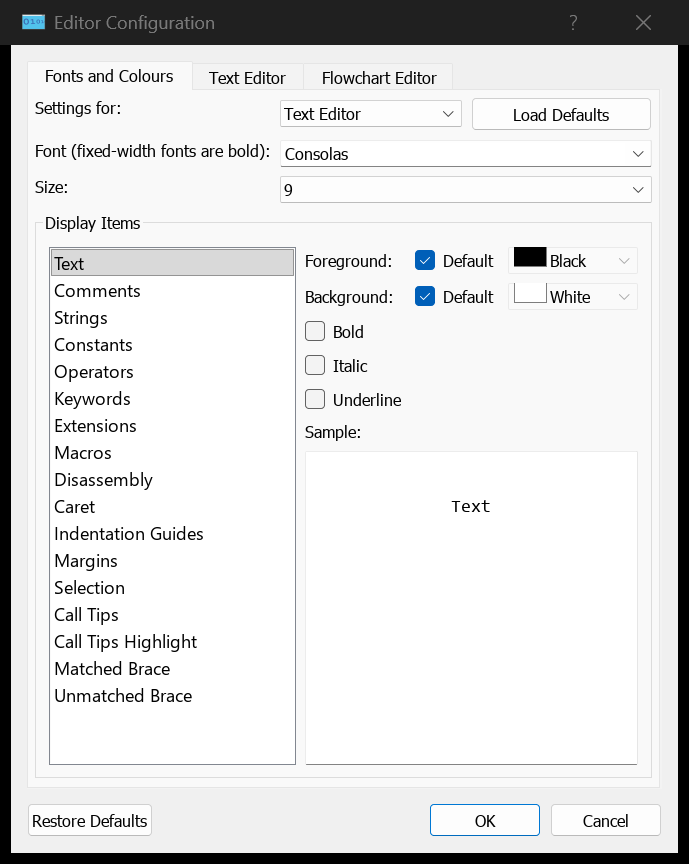
Choose the Window for Configuration.
- Next select the display item you wish to change and adjust using the styling commands on the right hand side of the dialogue form.
- Repeat for any other display items.
- Exit the dialogue form with the OK button to commit your changes.
The Editing Window contains several other styling options which allow you to configure things like code folding, indentation and line highlighting. As with all dialogue forms, specific information on these options can be found by selecting the Text Editor tab and then clicking on the question mark button at the top right.

Launching Context Sensitive Help for the Editor Configuration.