NEW PROJECT TUTORIAL
Introduction
The purpose of this tutorial is to show you, from first principles, how to conduct an interactive simulation using Proteus VSM. Both the schematic and the firmware are kept as simple as possible but the techniques covered will scale to projects of any size.
VSM Studio is not a requirement for a VSM simulation. You can attach a compiled firmware file to the processor part by hand, or drive the simulation from a third party IDE, but for a short project such as this one the integrated route shown here is the quickest way to get running.
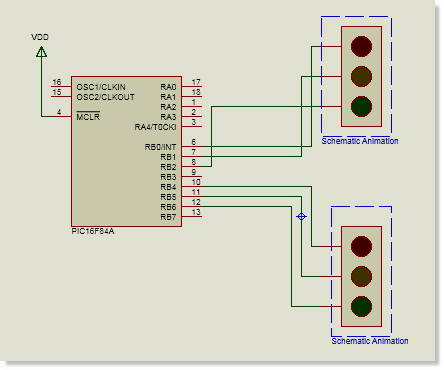
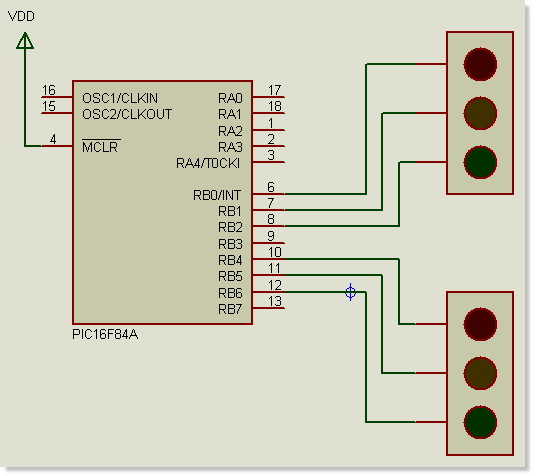
The circuit we will be using for the simulation is a pair of traffic lights connected to a PIC16F84A microcontroller as shown below:
The New Project Wizard
The easiest way to get started with a new project is to use the New Project Wizard on the home page. The home page appears when you first open Proteus or can be launched from the module toolbar at the top of the application.

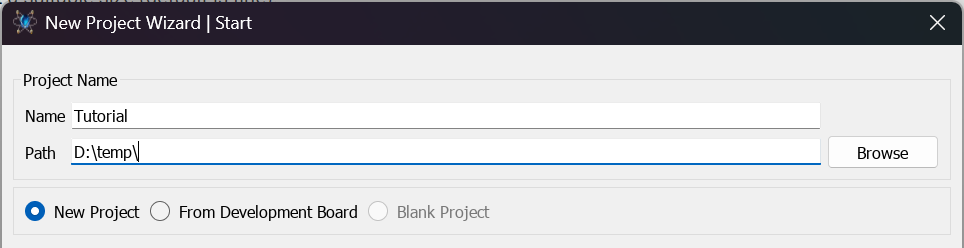
The first page of the wizard allows you to specify a name and destination directory for the project.
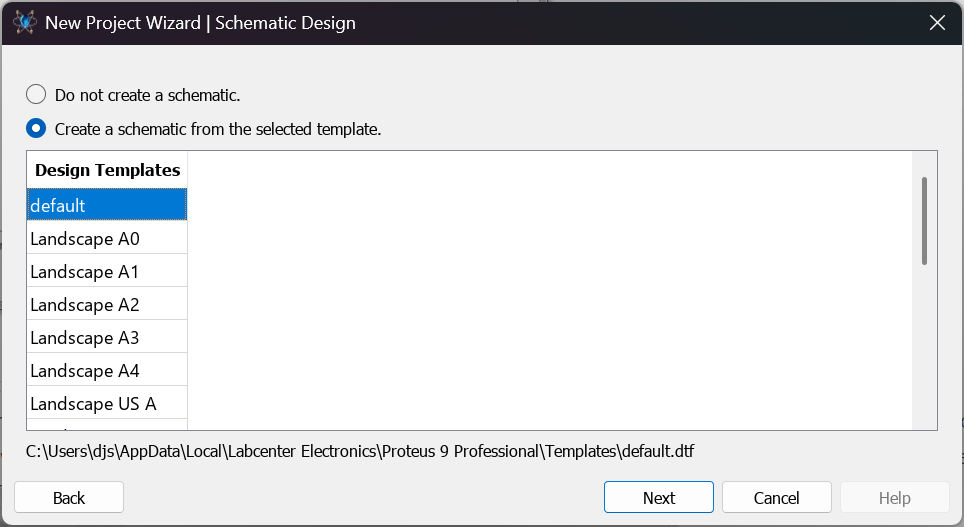
We will need a schematic design so check the box at the top of the next page and select a suitable size (default is fine).
We don't need a PCB layout for this project so if you see this page you can skip past it. If you do not have a licence for a PCB product this page will not appear in the wizard.
On the firmware page of the wizard we need to do some configuration. First select the Create Firmware Project option and then specify the family and the microcontroller.
For simplicity we are going to write our little program in assembly and will use the MPASM assembler installed with the Proteus software. All we need to do therefore is select the pre-configured MPASM assembler from the compiler drop-down list.
This will narrow down the list of supported compilers to those applicable to the specified controller. Depending on whether the compiler is installed on your computer or not, its entry in the combo box will have a 'not configured' suffix.
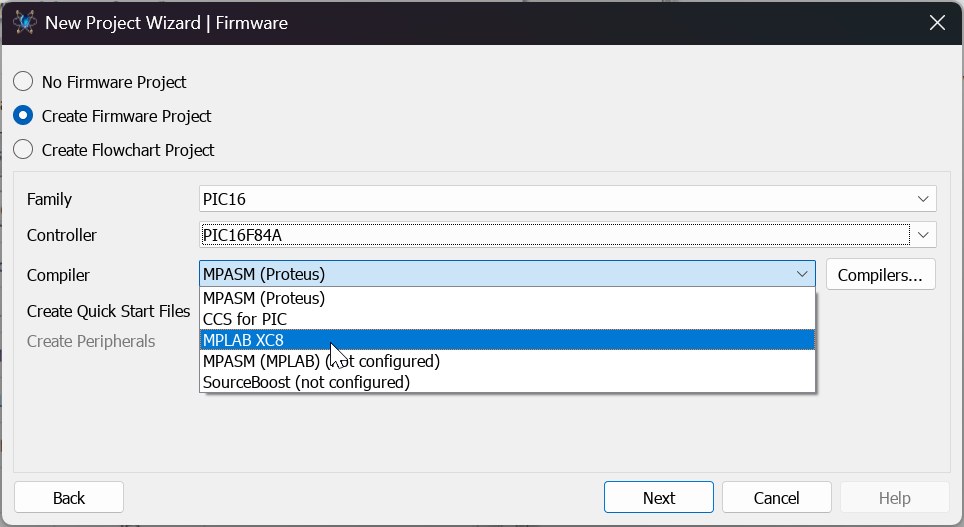
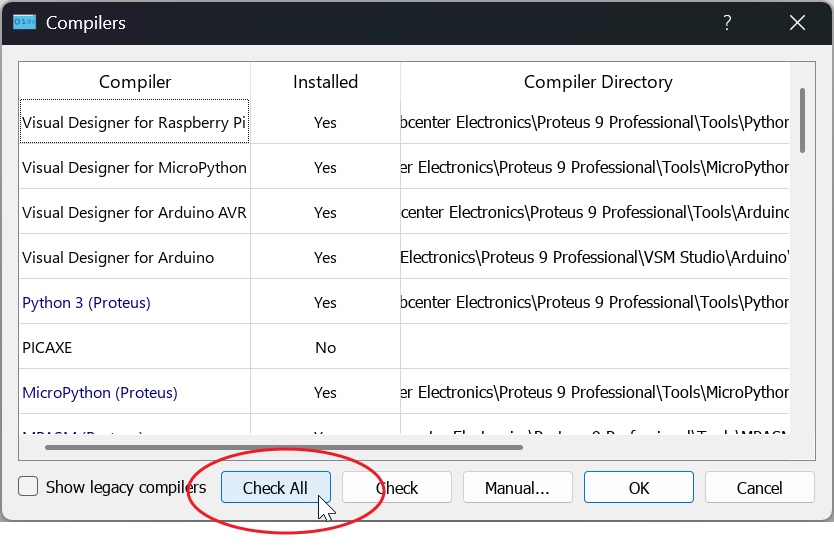
If you want to use a compiler that is not installed then you can click on the compilers button at the right hand side. The resulting dialogue will either let you download directly from Labcenter's website or will take you to the download page on the compiler vendor site. In either case, your procedure would be to install the compiler and then click on the 'check all' button at the bottom of the dialogue form to enable its Proteus configuration.
See Also :
Compilers and Compiler Detection.
Our last option is to create some skeleton firmware files. This is very useful as it will also set up linker scripts for us so leave this selected.
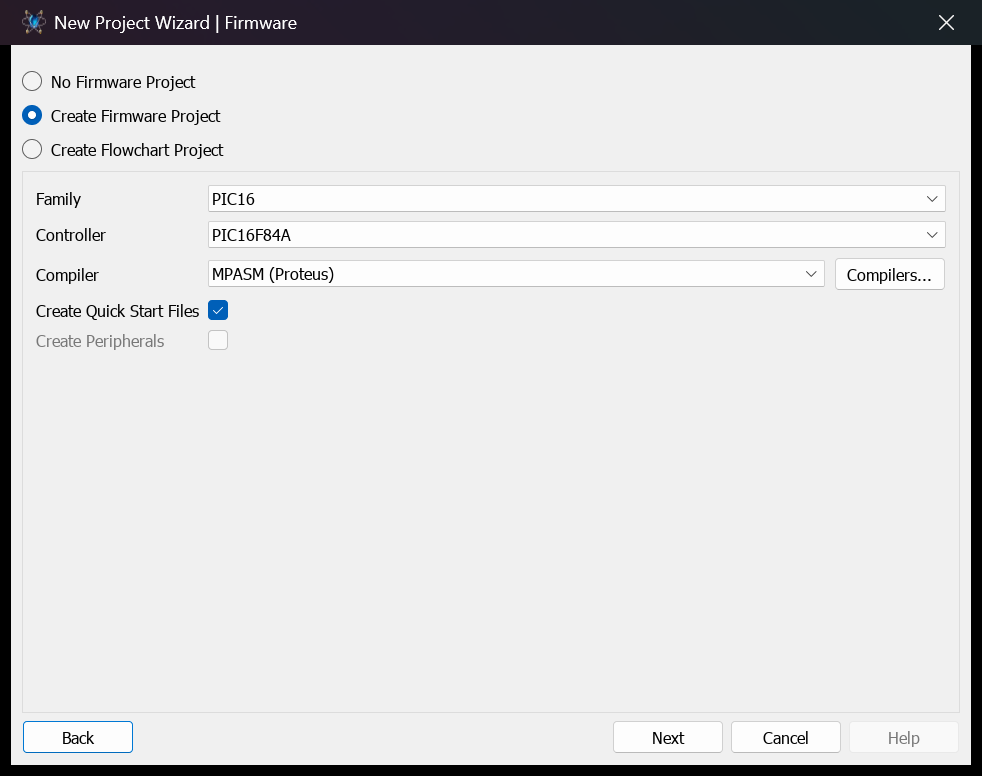
Configured settings for the tutorial project.
If we were working with Arduino then we could also check the option for 'Create Peripherals'. This enables the use of Labcenter peripheral drivers for Arduino shields and breakout boards, making development with these devices much simpler.
See Also:
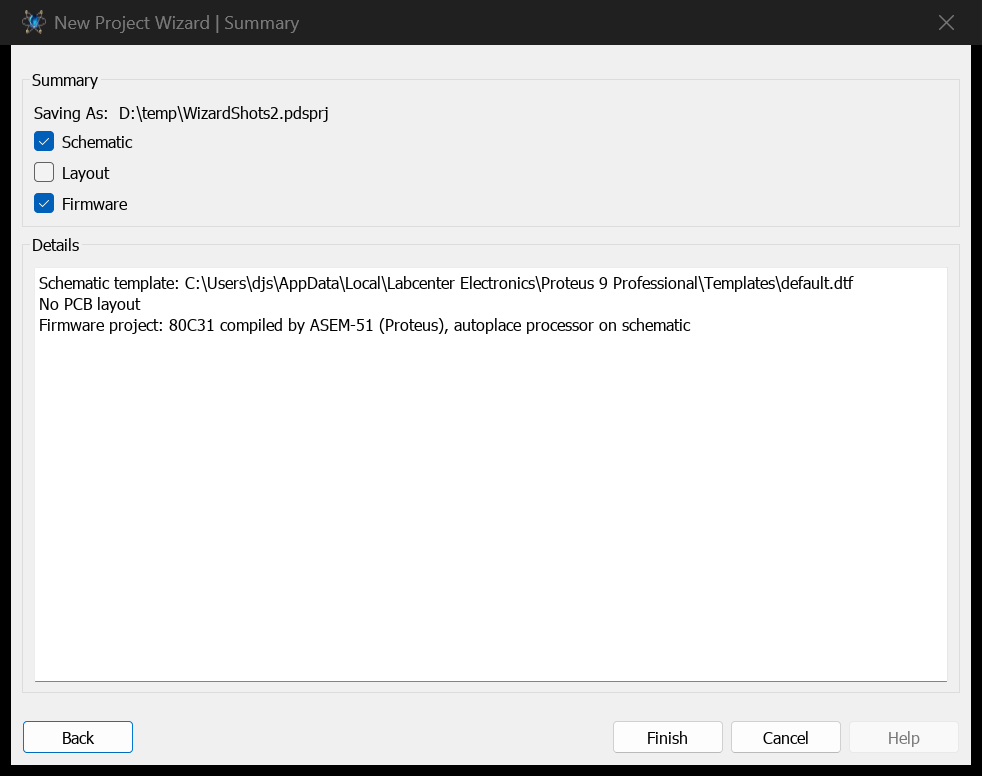
The last page of the wizard is then a summary of our configuration before we complete and create the project.
Exploring the Project
When you exit the wizard Proteus will create a new project which at first sight will look something like the following.

Quite a lot has happened at this point. Proteus has created two modules, one for the schematic capture design and the second for your firmware development. These modules are docked as tabs and you can switch between them by clicking on the tab at the top of the application (or via the CTRL+TAB shortcut key).
You can also split screen the two tabs by dragging one onto another monitor or a free area of your desktop.
The VSM Studio module has created a firmware project for you, populated it with a skeleton source file and configured the compile options for use with Proteus VSM. Meanwhile, in the Schematic Capture module the selected processor has been placed and powered.
We now need to complete our schematic design and write the firmware code to drive the simulation.
Drawing the Circuit
Note that the circuit will be auto-drawn if you are working with Arduino as all you need to do is import the shields or breakout boards.
We will start by placing and wiring two sets of traffic lights on the schematic. Since much of the detail of schematic placement is covered in the schematic tutorial we will move through this section fairly quickly.
Click on the schematic capture tab to enter the schematic module and then select component mode and use the 'P' button above the Object Selector to launch the Library Browser (the form itself is titled Pick Devices).
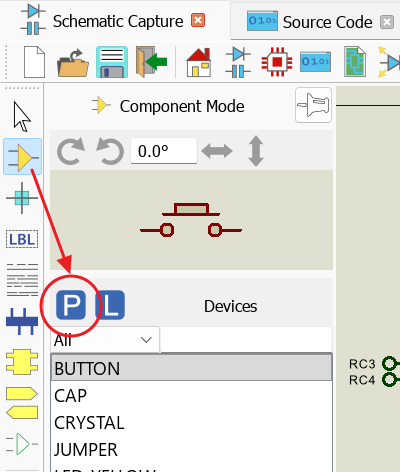
Type 'traffic lights' in the keywords list and then double click on the item in the results list to pick the part into the design. You should then see it appear in the object selector.
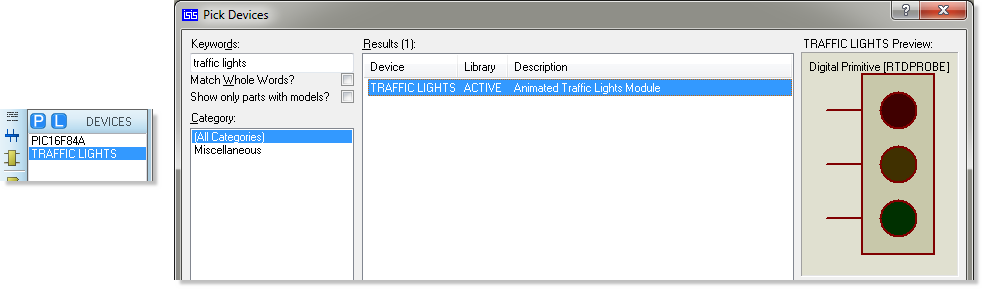
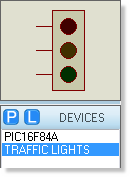
Close the library browser and click the mouse once on the traffic lights part in the object selector. This will highlight your selection and a preview of the device will appear in the Overview Window.
Now, left click on the Editing Window to enter placement mode, move the mouse to the desired location and left click again to place the part on the schematic. Repeat the process to place the second set of traffic lights.
Movement and Orientation
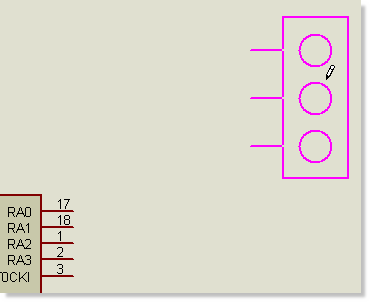
Our wiring will be far simpler if the traffic lights are placed to the right of the processor. To move a component, point the mouse at it, right click (this will highlight the component) and select 'Drag Object' from the resulting context menu.
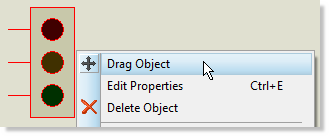
You can then move the mouse which will 'carry' the component and left click to place in its desired location. At this stage you want something like the following.
Zooming
In order to wire up the schematic it is useful to be able to zoom in to a specific area. The easiest way to do this is to hold down the SHIFT key and drag a box around the area you want to zoom into. Alternatively, you can use the middle mouse wheel or the F6 and F7 keyboard shortcuts to zoom in and out around the current mouse position. You can revert to a full screen view at any time using the F8 shortcut key. Finally, menu icons at the top of the application provide access to the same functions.
Wiring Up
Zoom in to the PIC microcontroller until all of the pins are visible and then place the mouse pointer over the end of pin 6 (RB0/INT). The mouse cursor will change to a green pen to indicate that you are on the pin tip and can start wire placement.
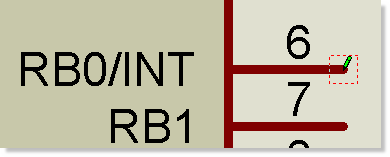
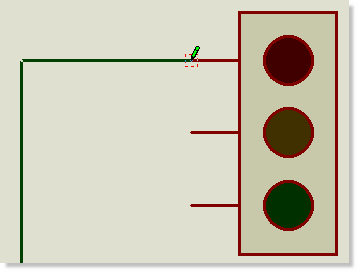
Left click the mouse to start a wire and then move the mouse to the pin connected to the red light on one of the sets of traffic lights. When you arrive at the pin on the traffic lights the mouse cursor will again change colour and you can left click to commit the wire placement.
Repeat the process to wire up both sets of traffic lights, using the following as a guide.
If you need more control over wire placement you can left click to change direction at any time while placing a wire.
If you make a mistake during wire placement use the ESCAPE key to abort the wire. If you make a wiring error you can delete the wire by right clicking the mouse on the wire and selecting Delete Wire from the resulting context menu.
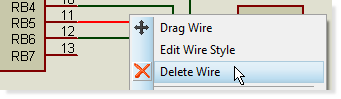
There are a couple of points worth noting about the wiring process:
- You can wire up in any mode: the schematic module is clever enough to determine what you are doing.
- You can left click the mouse during wire placement to commit existing wiring and change direction at that point.
- The schematic module will automatically pan the screen if you nudge the edge of the Editing window while placing a wire. This means that you can zoom in to the most suitable level for placing the wire and, so long as you know the approximate position of the target component, simply nudge the screen over until it is in view. Alternatively, you can zoom in and out while placing wires using either middle mouse wheel or the F6 and F7 keys.
We now have a simple schematic which we can drive by writing some firmware.
Writing the Program
Click on the VSM Studio tab to switch the application to the firmware IDE. For the purposes of this tutorial we will use the following program which will enable the PIC to control the traffic lights. You can either type directly or copy and paste the following into the source file in VSM Studio.
;====================================================================
; DEFINITIONS
;====================================================================
#include p16f84a.inc ; Include register definition file
;====================================================================
; VARIABLES
;====================================================================
cblock 0x10 ; Temporary storage
state
l1,l2
endc
;====================================================================
; RESET and INTERRUPT VECTORS
;====================================================================
; Reset Vector
RST code 0x0
goto setports
;====================================================================
; CODE SEGMENT
;====================================================================
PGM code
setports
clrw
movwf PORTA
movwf PORTB
bsf STATUS,RP0
clrw
movwf TRISB
bcf STATUS,RP0
initialise
clrw
movwf PORTB
loop
call getmask
movwf PORTB
incf state,W
andlw 0x04
movwf state
call wait
goto loop
; Function to return bitmask for output port for current state.
; Top nibble controls one set of lights and bottom nibble the other.
getmask
movf state, W
addwf PCL,F
retlw 0x41 ; Green and Red.
retlw 0x23 ; Amber and Red/Green.
retlw 0x14 ; Red and Green.
retlw 0x32 ; Red/Amber and Green.
; Simple delay routine.
wait
movlw 0xFF
movwf l1
w1 decfsz l1
goto w1
return
wait2 clrf l2
w2 decfsz l2
goto w2
return
;======================================================
END
See Also:
There is, in fact, a deliberate mistake in this program but we'll come back to that later.
Compilation
If need be, project settings can be accessed from the context menu after right clicking on the project name, from the Project menu, or from the Project Settings button on the Build toolbar.
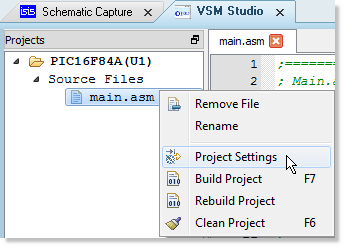
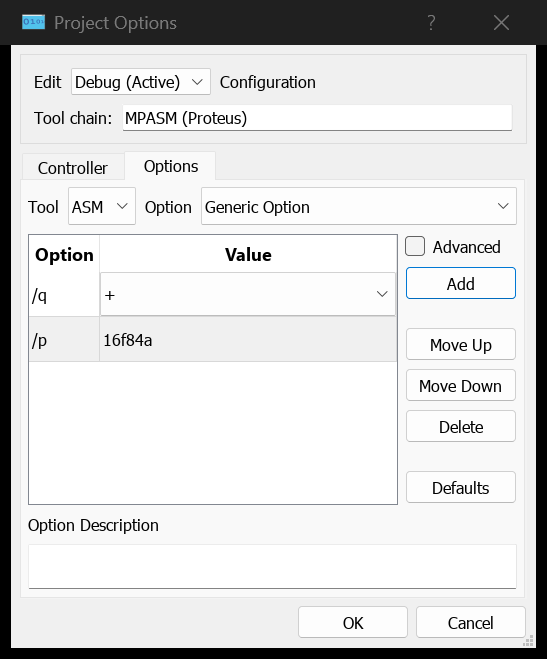
Switching to the Options tab of the dialogue (which is titled Project Options) then provides access to all of the arguments available to the specified Tool Chain. Notice that both the assembler and linker options have been configured for us and, for this simple project, the default settings are sufficient.
See Also:
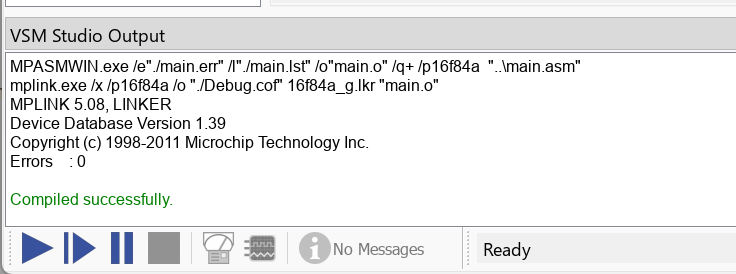
Since no further configuration is required we can go ahead and build our program. Select the build project option from the build menu or use the CTRL+F7 keyboard shortcut to start compilation. Output from the assembler will be written to the output window at the bottom of the IDE and you should see a 'Compiled Successfully' message when complete.
Simulation and Debugging
We now have both compiled firmware and a design to test it on. To start a simulation simply press the play button at the bottom left of the application.
This will switch the application to the schematic module and the simulation will start running. Elapsed time and percentage CPU consumed are displayed on the status bar while the schematic will indicate the state of the circuit given the currently executing firmware.
You can also take live measurements while the simulation runs: the Multimeter and Scope buttons on the animation control panel launch the System Meter and the System Scope. See Testing and Debugging for more on the facilities available during a simulation.
In our example what you will see is that one of the traffic lights is green while the other is red. Unfortunately, they are not changing state due to a bug in our firmware. Time to look at the source code and do some debugging.
Setting Breakpoints
Start by clicking the Pause button on the animation control panel at the bottom of the application. This will pause the simulation and the focus will switch back to the VSM Studio IDE.
In the editing window area of the IDE you should see the executing program with a line overlay of the current instruction.
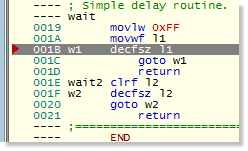
Looking at the program it can be seen that it loops back on itself on a repeating cycle. It would therefore be a good idea to set a breakpoint at the beginning of this loop at the call to the getmask routine.
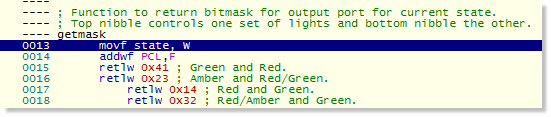
You can do this by clicking on the line and on the breakpoint icon. Alternatively, double clicking on the source line will set the breakpoint automatically.
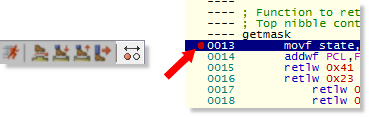
Breakpoints set anywhere in the project are listed together in the Breakpoints window, which you can open from the Edit menu or with the SHIFT+F9 shortcut key.
Having set the breakpoint, use the play button to run the simulation. It will in short order pause again, this time with the executing source line on our breakpoint.
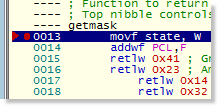
A list of debugging commands is given on the debug menu and replicated on the debug toolbar but the one we will be using most often is F11 to single step through the program.
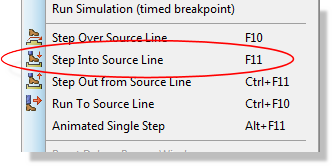
If you try this now you should see the execution of the call instruction, leaving us at the entry point of the getmask instruction. Before we step further it's worth opening some more debug windows so that we can verify correct operation. From the debug menu, select the registers window which will appear as a tab at the bottom of VSM Studio. If we execute a single step operation (F11) now we should see that the value of the state variable is applied to the W register.
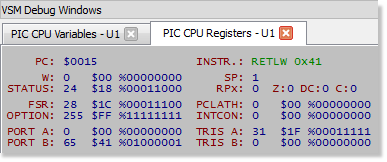
Stepping forward again, we will see that we 'land' in the expected place for adding an offset of zero onto our lookup table. A further step exits us from the getmask routine with a valid mask representing Green and Red, exactly what we see on the schematic traffic lights.
If we continue to single step (F11) while watching the registers display we can see that we write the correct mask to the port (PORTB equals our mask) and then that we correctly increment the state (value for W is incremented). The next instruction is designed to wrap the state around to zero when it is incremented above 3 and we need to look more closely at the state variable to verify this. The easiest way to do this is to open the watch window and then monitor the address of the state variable. You can open the watch window from the Debug Menu and it will appear as a tab at the bottom of VSM Studio.
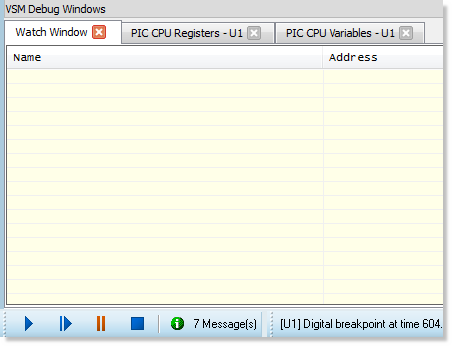
Now right click on the watch window and select add item by address. Type the variable name (state) and the address as 0x10 (as we specified in our firmware) and click Add then Done.
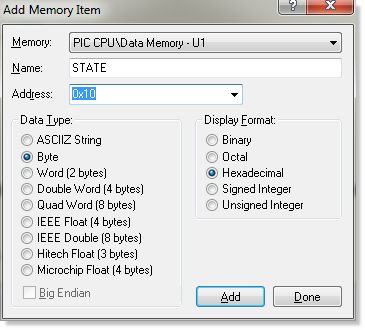
Now single step the code beyond the setting of the state variable to check whether it increments correctly. We can see straight away that this is not happening. On closer investigation the problem is caused by ANDing with 4 instead of with 3. The states we want are 0,1,2,3 and any of those values when ANDed with 4 gives 0. The solution is simply to change the problem instruction to AND the state with 3 instead of with 4.
To do this we must first stop our debugging session (click the stop button on the animation control panel).
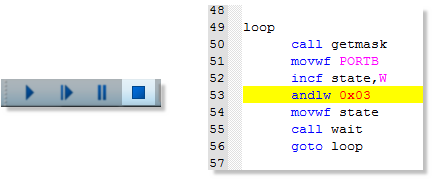
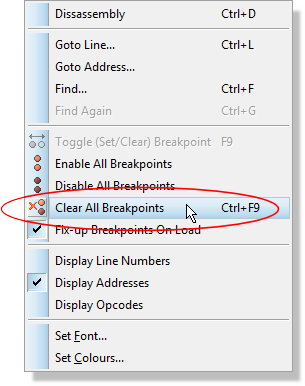
After changing the problem line of code we need to re-compile (CTRL+F7) and then run our simulation again. We will soon hit our breakpoint and can repeat our single stepping exercise to validate our change. Alternatively, right click on the editing window in VSM Studio and select the Clear All Breakpoints command (CTRL+F9) to allow the simulation to run freely. It should be clear from the schematic alone that things are now working.
Active Popups
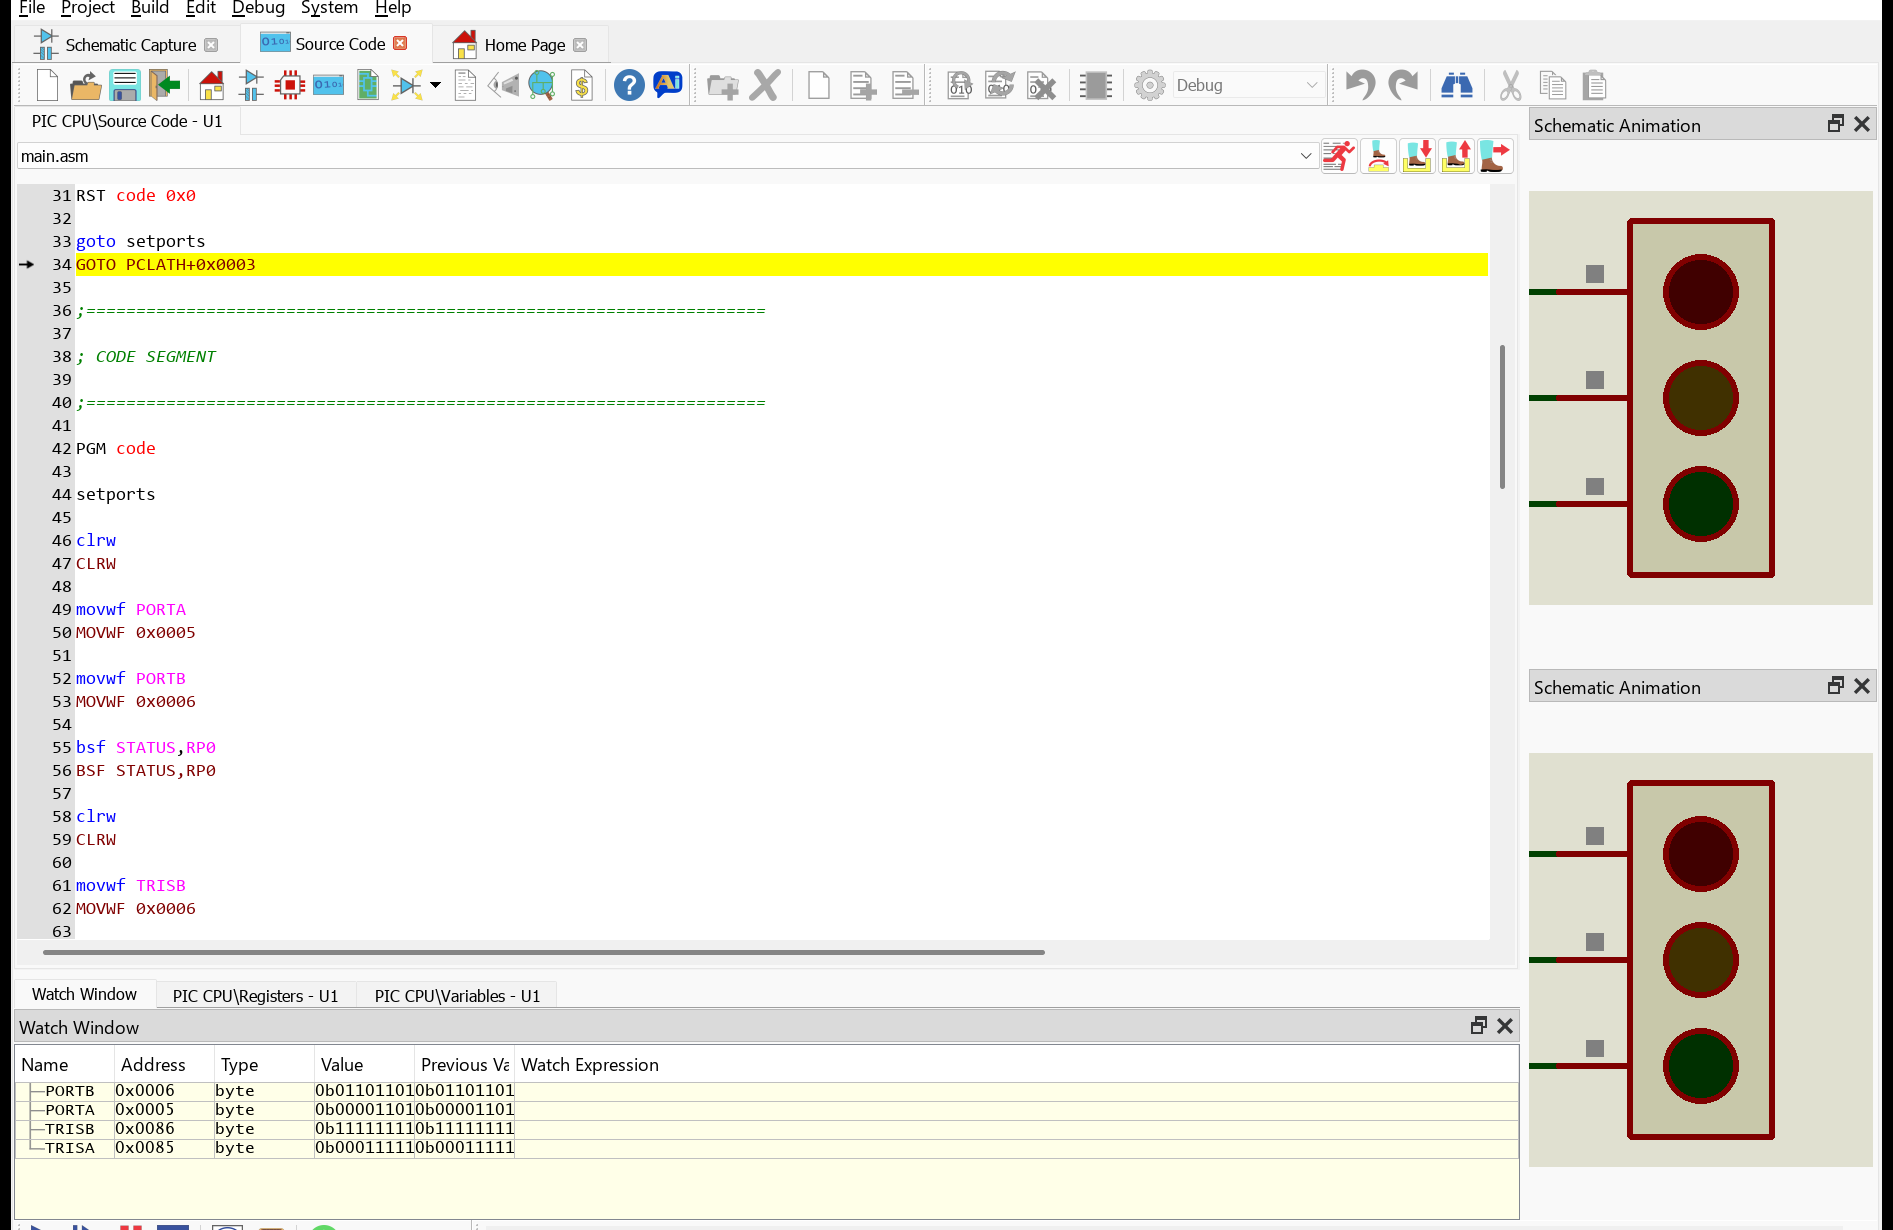
It is an inconvenience to have to switch between the source code you are stepping through and the design you are testing. Fortunately, you can bring parts of your schematic into your debugging IDE by using Active Popups.
With the simulation stopped switch to the schematic capture module and then select the Active Popup icon. Now drag out boxes around areas of interest on the schematic, in our case both sets of traffic lights.
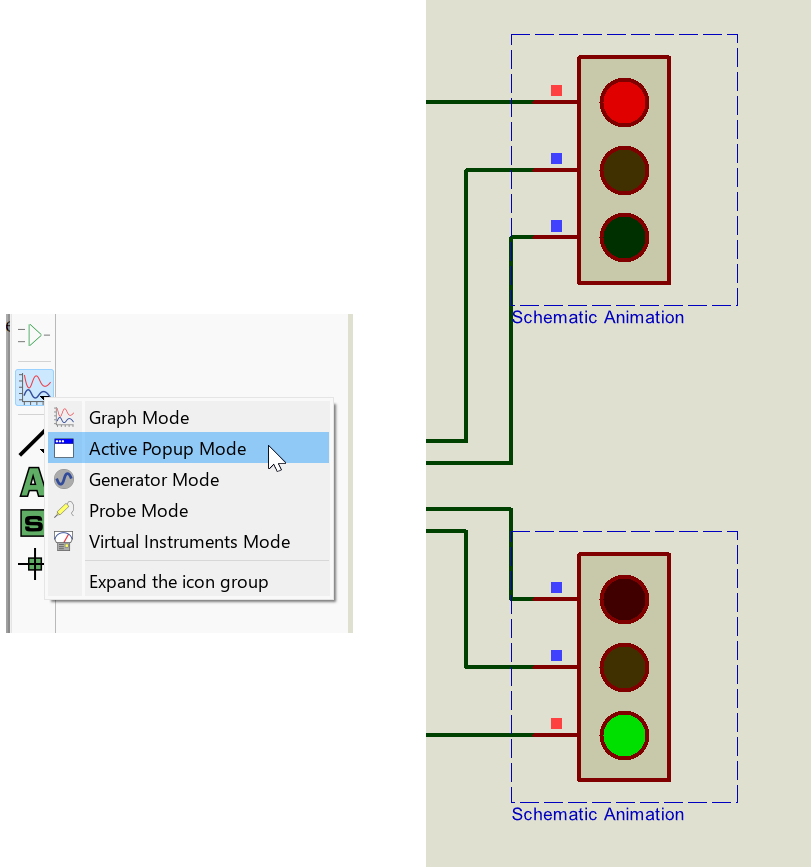
Now, when you run the simulation the animation takes place inside VSM Studio and, more importantly, when you single step debug you will see the effects of your code execution without having to switch to the schematic.
There is a great deal more power to the VSM simulation and debugging than we have covered here. We strongly recommend you work fully through the main VSM tutorial which works with the Microchip F1 Evaluation board using C language programming and therefore presents far more realistic debugging scenarios.