Guided Tour
Guided Tour of the EDAi Window
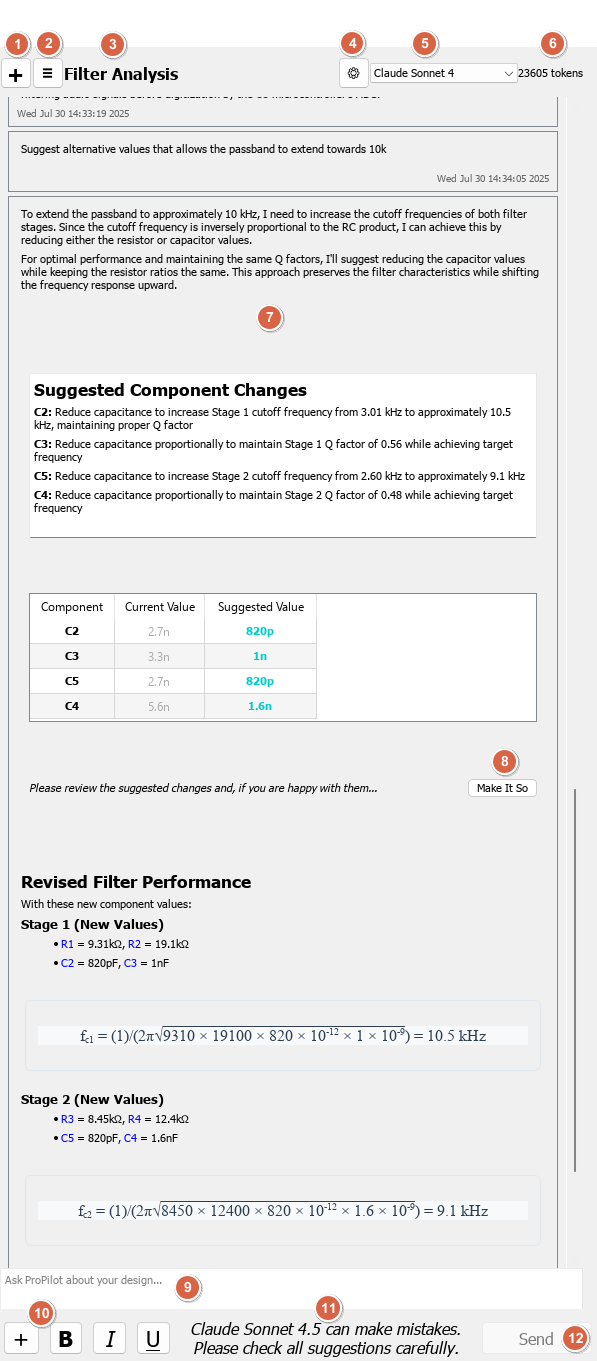
The EDAi window is fully integrated into the Proteus workspace, offering real-time, circuit-aware help. The following walkthrough covers each part of the interface.
|
|
1. New Chat Button ( + )Located at the top-left corner, this button starts a new session with the assistant. |
2. Session List Button ( ☰ )Next to the new chat button, this button toggles the sessions panel, showing a list of recent sessions. |
|
3. Session TitleDisplays the active topic, for example "Filter Analysis". |
|
4. Settings ButtonOpens the ProPilot Configuration dialogue, where you can:
This is where initial setup is handled, and you can return here at any time to switch providers or update credentials. |
|
5. Model SelectorThis dropdown lists the models available from the provider you have configured, not the providers themselves. The provider is chosen in the settings dialogue; once a valid API key is in place, the model list is fetched from that provider and appears here. Different models from the same provider vary in cost, speed, and output quality. You can switch models at any time during a session to compare performance or handle specific tasks more effectively. Check your provider's pricing page so that you know what a model costs before you switch to it. |
|
6. Token Usage IndicatorThe number shown here is the size of the current session context, in other words how much material is being carried into each request to the model. It gives you a running sense of how large the conversation has become and how close it might be to the model's limit. Hover over the number for a breakdown of cumulative usage in the session:
|
|
7. Chat Transcript AreaThis scrollable area displays the full exchange between you and the assistant, including your messages, the assistant's responses, and any structured content such as calculations, tables, or analysis results. When the assistant references specific components, such as R1, C5, or U3, these appear as hyperlinks. Clicking one of these links will immediately jump to and highlight the corresponding component on the schematic. |
|
8. Suggested Action ButtonsInteractive buttons like "Make It So" appear when the assistant suggests schematic edits. |
|
9. Input FieldLocated at the bottom, this is where you type your questions, prompts, or instructions. |
|
10. Attachments ( + )This button opens the attachment menu, from which you can choose a file, paste the clipboard contents, or pick up context that Proteus can supply for you such as the compiler output or the simulation log. You can also drag and drop a file onto the chat, or paste an image directly. |
|
11. Model DisclaimerJust below the input field, a line of text reminds you that the AI can make mistakes. |
|
12. Send ButtonClick Send or press ENTER to submit your message. |
Further Controls
Several further controls appear in the chat panel, some of them only when they are relevant.
Session Search
The sessions panel has a search box at the top. Type part of a session title to filter the list, which is the quickest way back into a conversation from a few days ago.
Text Zoom
Hold CTRL and turn the mouse wheel over the chat to scale the text up or down. The zoom button in the input area resets the text back to 100%.
Step Indicator
When a structured lesson plan is running, the header shows the current position in the lesson as Step N/M, changing to Lesson Completed at the end. Hover over it to see how many steps have been completed.
Lesson Progress Bar
Below the header, a segmented bar shows one segment per step in the lesson and marks the steps that have been completed. While you are testing a lesson plan during an authoring session, the bar is also clickable, so you can jump straight to a particular step rather than working through the whole lesson again. During a normal student session the bar is an indicator only.
See Also:
Additional Information
Component Changes
While the "Make It So" button offers a convenient way to apply AI-suggested value changes directly to components in the schematic, it is important to understand the intended use:
- This feature is designed for use with generic, untracked parts, such as basic RES and CAP primitives, typically during early design stages, simulation, or virtual prototyping.
- If you are working with physical components, particularly those tied to stock codes, supplier links, or custom properties such as tolerances and packaging, automatic value changes may disrupt your bill of materials (BOM) or sourcing process.
- This function is also not compatible with managed libraries, where part data is centrally controlled and should not be altered locally.
Best practice is to use AI-suggested edits for conceptual exploration, virtual prototyping and simulation only. For production designs, or any project tied to a structured parts database, apply changes manually and follow your organisation's library or approval workflow.
Model Selector and Costs
The model selector is populated from the provider's API, so the list of available models reflects the current offerings from your chosen provider.
- New models are released regularly and will appear in the list once you refresh it in the settings dialogue.
- Pricing and performance change over time, with newer models often improving on both. In many cases the cost of older models drops as newer versions are introduced.
Most commercial AI models are charged per million tokens processed. The token figure displayed in the session gives you a rough sense of the volume involved. Check your provider's usage dashboard and pricing pages periodically to stay informed, since switching to a newer or more efficient model may improve results and reduce cost.
See Also:
Attachments
Attachments give the assistant material to work from beyond the design itself. The attachment menu on the plus button always offers two entries, Choose File and Paste from Clipboard, and Proteus adds further entries when it has something relevant to contribute:
Compiler Output, the contents of the VSM Studio output window. If you get compile or link errors you can attach the output directly. Since the assistant can also see your source code and schematic, it can analyse your code to help fix the problems.
Simulation Log, normally used for a debug session where you have turned on diagnostic messaging. This gives the assistant more insight into circuit design and operation.
System Terminal, the terminal in VSM Studio that you use to communicate with the hardware after programming, offered when the terminal is in view.
While a simulation is running, the menu instead offers the contents of any virtual terminal popups on the schematic, so you can hand the assistant what a serial device has actually printed.
You can also attach files manually, by drag and drop, by copy and paste, or with the file selector on the plus button. Text, log, JSON, XML, image and PDF files can all be attached. Be aware that large files involve more tokens.
For general questions there is usually no need to attach a component PDF, because the models are trained on the public internet and will already have digested that information. Library part creation is the exception: there, pasting the specific pages you care about as screenshots gives markedly better results than attaching a whole datasheet. See Library Part Creation.
The schematic itself is not something you need to attach. Proteus supplies the design context to the assistant automatically.