THE SIMULATION LOG
Overview
Whenever a simulation is performed a Simulation Log is generated. It holds all the information, warning and error messages produced by the simulator itself and by the individual models in the design, and it is the first place to look whenever a simulation does not do what you expected.
The log is not a file that you have to go and find. It is generated as the simulation runs and presented to you in a window. If you do need a real file, for example to send to technical support, see Writing the Log to a File below.
Where a message originates from a model rather than from the simulator, it is prefixed with the model's component reference in square brackets, so you might see:
[U1] Loaded 8192 program bytes and 0 data bytes.
Messages are quoted throughout this chapter exactly as the simulator writes them, so that you can search the help for the text you are looking at. Where a shipped message uses an American spelling, the quotation keeps it.
Opening the Simulation Log
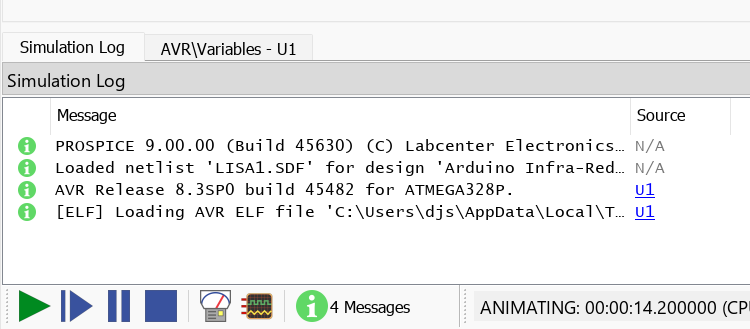
In an interactive simulation the log is reached from the message counter at the right hand end of the Animation Control Panel. The counter is itself a button: it reads No Messages before anything has been logged, then a running count such as 12 Message(s), and it changes to a count of errors in red as soon as an error occurs. Click it to open the log, at any point during the run or after it has finished. The same window can also be reached by pressing ALT+D for the Debug menu and then the number alongside the Simulation Log entry.
For a graph based simulation, point at the graph and press CTRL+V, which is the View Simulation Log command. The same command has a button on the graph window toolbar. It opens the log on a Log Viewer tab rather than in the interactive popup window.
When You Are Prompted
You are not shown the log automatically when a simulation fails. Instead you are asked. On a fatal failure the message is "Fatal simulation error(s) encountered" followed by "View the simulation log?", and answering yes opens the log under the title SIMULATION ERROR LOG. Where a run completes but produces warnings, the prompt is "View Simulation Log?" with the explanation "The Simulation Log generated by Proteus details the progress of the simulation and lists warnings that can help you resolve potential problems.". Where a run aborts part way through you are asked "Load partial results?" instead, and declining opens the error log.
Answering no to any of these prompts does not throw the messages away. The log is still there, and you can open it at any time from the routes above.
The Window Titles
The title on the log window tells you which stage of the process reported the problem, which in turn tells you which of the topics in this chapter to read. There are four:
| Title | What was running |
| NETLIST COMPILER ERRORS | The netlist could not be built from the schematic. See Netlisting Errors. |
| NETLIST LINKER ERRORS | The netlist was built, but a model could not be attached to a part. See Linking Errors. |
| PARTITION ANALYSER ERRORS | The models were linked, but the circuit could not be divided into partitions to simulate. See Partitioning Errors. |
| SIMULATION ERROR LOG | The simulation itself failed. See Simulation Errors and Convergence Problems. |
A run that completes normally simply leaves the window titled Simulation Log. A netlist compiled for export rather than for simulation reports under the title Netlist Errors.
Reading a Message
The log is a structured window rather than a page of text. Each message occupies a row with a severity indicator, the message itself under Msg, the component that produced it under Source and, where the message carries one, the simulated time at which it was logged under Time. Running counts of warnings and errors are maintained as the run proceeds, and these are what the Animation Control Panel counter reflects. The window is dockable and resizable, so you can park it at the bottom of the editor and watch messages arrive while the simulation runs.
Net and part names inside a message are links. Almost every message that concerns a particular net or a particular component carries one, and clicking it takes you to that object. This is the quickest way to get from a message you do not understand to the piece of circuit that caused it, and it is worth trying before anything else in this chapter.
The Simulation Log docked at the foot of the editor, showing a warning with a clickable net link and a non zero warning count
The log window itself, its Source column navigation, its net navigation through the Design Explorer and its context menu are covered in Diagnostic Tools.
Controlling What the Log Records
Several of the messages described in this chapter are not produced unconditionally. They belong to diagnostic channels, and a channel that has been turned down or switched off records nothing. If a message you expected is missing, this is the first thing to check.
Choose Configure Diagnostics from the Debug menu. Alongside the per part trace categories, the dialogue form carries eight channels that belong to the simulator as a whole:
- SPICE model linkage, which reports how each SPICE model was found and bound.
- SPICE simulation options, which reports the option values in force.
- DC path analysis, which reports nets with no DC path to ground.
- Mixed mode net type analysis, which reports how each net was classified as analogue or digital.
- Mixed mode interface models, which reports the interface models inserted between the two domains.
- Digital logic contentions, which reports nets driven to conflicting states.
- Simulator performance, which reports where the simulation time is being spent.
- Numerical Convergence, which reports the solver's own difficulties.
Each channel is set to Disabled, Warnings Only, Full Trace or Debug, in increasing order of detail. Every channel starts at Warnings Only, so a warning level message appears unless you have deliberately turned its channel off, and the trace level detail appears only when you ask for it.
The dialogue form and the procedure for using it are described under Configuring Diagnostics, and field by field in the Configure Diagnostics dialogue page.
The Logging Time Window
Logging is also limited in time, and this catches people out. Information, trace and data messages are suppressed until the simulated time reaches the start time set in the Configure Diagnostics dialogue form, and logging stops altogether once the simulated time passes the end of the logging window. The window defaults to 60 seconds of simulated time, which is ample for most designs but not for a long running one.
When the window closes the log says so, once:
Logging stopped - check times specified in Configure Diagnostics dialogue form.
If your log stops in the middle of a run, or a diagnostic you configured never appears, extend the logging window rather than looking for a fault in the circuit. Errors are never suppressed by this mechanism, so a log that ends this way is not hiding a failure from you.
Diagnostic Breakpoints
Any diagnostic channel can be made to halt the simulation at the moment it has something to say, by ticking Suspend simulation whenever an event is logged? for that channel. This turns a log message into a breakpoint, which is by far the easiest way to catch a condition that occurs once, deep into a run, and leaves no trace by the time you notice it. Because a halt freezes the entire simulation, everything else in the design is left exactly as it was at that instant for you to inspect.
The simulation reports why it stopped, either as
Diagnostic breakpoint at time <time> [<channel>]
during the run, or as
Diagnostic breakpoint at startup [<channel>]
where the condition arose before simulated time began.
Writing the Log to a File
Adding a LOGFILE property to the design, with a filename as its value, writes the whole log to that file as the simulation runs. This is the way to produce a log you can keep, compare against a later run, or attach to a support enquiry.
Where third party SPICE or VSM models have been used, we cannot spend time debugging them unless you can supply a simple circuit demonstrating the problem. A log on its own is rarely enough.
When the Simulation Will Not Run at All
Not every failure is a fault in the design. A simulation can also fail outright because the feature it needs is not covered by your licence, and the message says so rather than reporting a circuit problem.
Interactive simulation runs on every licence. If it reports
You do not have a valid Product Licence Key for PROSPICE Interactive simulation.
then the installation is not licensed for simulation at all. The graph based analysis types belong to the Advanced Simulation Features, and an installation without them reports
You do not have a valid Product Licence Key for the PROSPICE Advanced Simulation features which include all the graph based analysis types.
The simulation feature set and what belongs to it are described under Graph Based Simulation.
See Also: