The Photovoltaic Effect
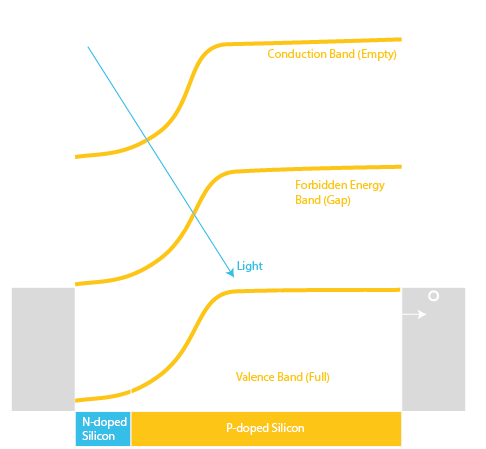
The photovoltaic effect was discovered by A.E. Becquerel in 1839 and provides a demonstration of the corpuscular nature of light and electromagnetic radiation in general. This effect is a physical phenomenon that occurs when an electron present in the valence band passes to the conduction band due to the energy released by the photons. The phenomenon is summarized in the following drawing:
 The PhotoVoltaic Effect.
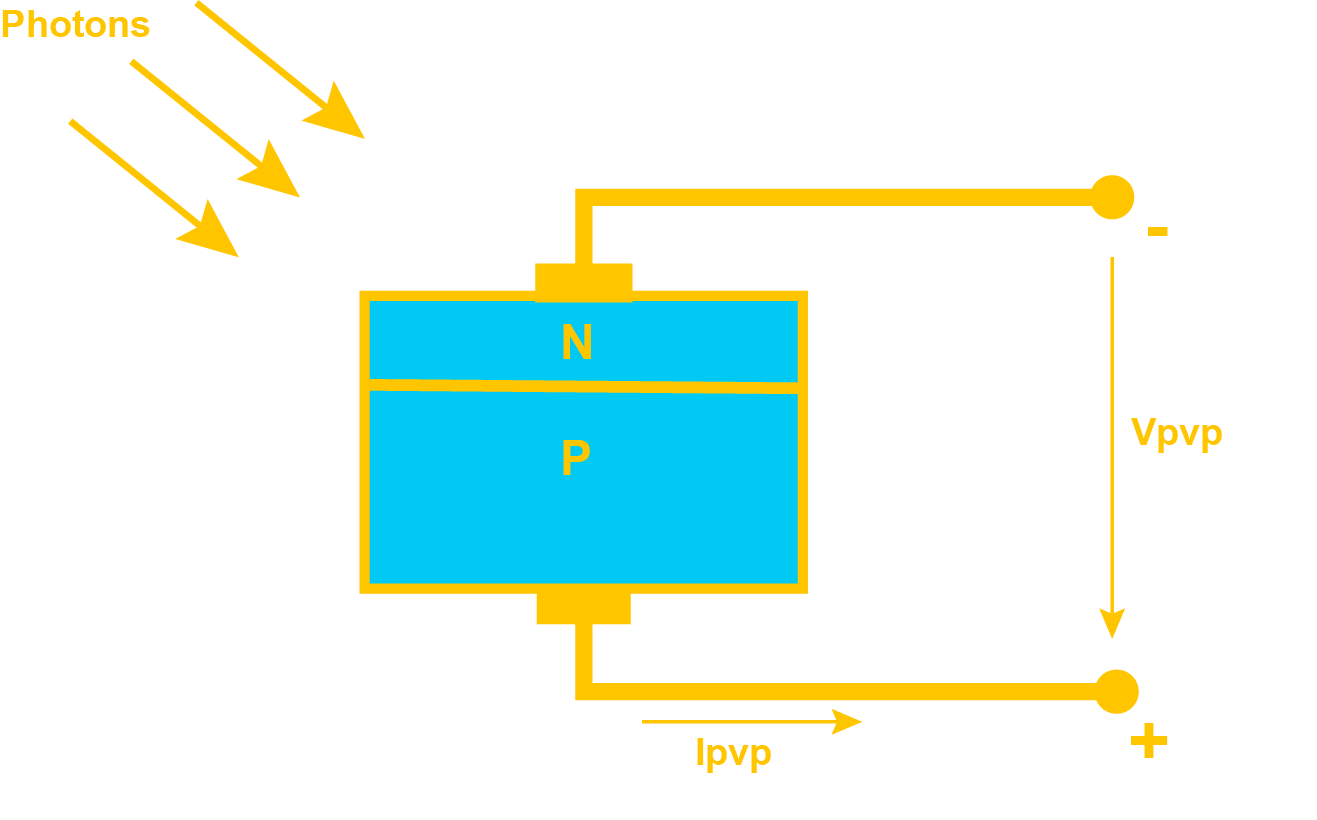
A photovoltaic cell is represented by a P-N silicon junction where light energy passes through the surface and excites the junction.
When the junction is excited by light, photons that have energy equal to the band gap (Eg) of silicon material produce a pair of electric charges, an electron and a hole, and therefore a current flow. For silicon panels the typical Eg value is between 1 and 1.8 eV.
Efficiency
Unfortunately only a small number of photons have enough energy to create this phenomenon. About 40-50% of photons have either too little or too much. Photons of energy less than the required band gap will not contribute to the creation of electricity, while those greater than Eg will waste energy (dissipated in heat). Furthermore, about 25-30% of the photons do not penetrate the cell and do not reach the Junction but are reflected from the cell surface or on the contacts. Finally, about 5% of the electron-hole pairs are recombined and therefore do not generate any current.
This implies that the efficiency of photovoltaic panels in operating conditions is of the order of 10-15% typically with peaks of around 20% in mono-crystalline silicon panels.
Solar Radiation
The incident energy of solar radiation is a value considered by convention to be equal to 1000 W/m^2.
This value is achieved only in particular conditions of latitude, position, pollution, etc. It is typically achievable at the equator with light exposed directly. In other latitudes or environmental conditions, the solar radiation values in optimal conditions can vary from less then 600 to 800 W/m^2 and only for a fraction of the day.
Photovoltaic Panel
As mentioned previously, the photovoltaic cell is similar to a P-N junction diode.
Photovoltaic panels are the series-parallel combination of a number of junctions. They are available with voltage ratings typically from 12 to 24V with open circuit voltage ratings from 20 to 40V. Powers ranging from a few Watts up to several hundred Watts are available.
Equivalent Circuit and Mathematical Model
A photovoltaic cell can be simplified with a direct current generator whose value depends on solar radiation. The equivalent circuit of a cell is schematized below:
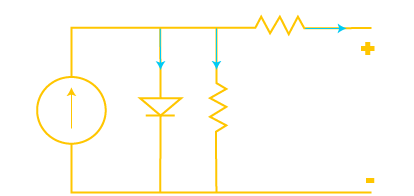 Equivalent Circuit for a Photovoltaic Cell
To describe the current in the load we can use the Shockley equation and the equivalent circuit above. This current, I, is described by the following equation:
 The Shockley Equation.
Where:
- Ie is the current in the cell expressed in Ampere.
- Il is the current proportional to the intensity of solar radiation.
- Io is the saturation current of the diode, in Amperes.
- q is the charge of the electron. i.e. 1.6E-19C
- K is Boltzmann's constant. i.e. 1.38E-23J/K.
- Rs and Rp are the series and parallel resistances in Ohms.
- V is the output voltage expressed in Volts.
Characteristic Curve I-V
The equation above describes the I-V characteristic of the photovoltaic cell. By multiplying the current by the number of the cells in parallel and/or adding the voltages of the cells in series, the I-V characteristic of the complete photovoltaic panel is obtained. A typical feature is shown below:

However, the variation of the intensity of the solar radiation causes a corresponding variation of both the voltage and the output current. Documentation of commercial photovoltaic panels typically report the I-V characteristic at different intensities of solar radiation. An example is shown in the following picture:

The Proteus Photovoltaic Panel Model
Proteus includes a realistic simulation model of a generic photovoltaic panel.The model can be easily configured by entering the typical parameters of a commercial product. These parameters are generally always provided in the photovoltaic panel manufacturer's data sheet. These parameters are:
- Open Circuit Voltage (Voc) is the open circuit voltage across the panel.
- Short Circuit Current (Isc) is the short circuit current of the panel.
- Voltage at Pmax (Vpm) is the voltage at maximum power.
- Maximum Power (Pmax) is the maximum power of the panel.
- Temperature Co-efficient of Voc (typically TC Voc) is expressed in %/deg C.
- Temperature Co-efficient of Isc (typically TC Isc) is expressed in %/deg C.
Sometimes Imp (I @ max power) is given instead of Pmax value. In such the case Pmax is calculated as:
Pmax = Vmp x Imp
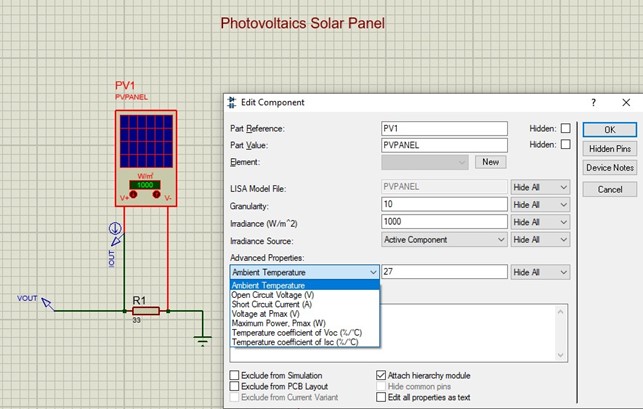
Entering Properties in Proteus
As always, we can enter model parameters by editing the part and changing the property values. This is done by right-clicking on the part and clicking on Edit Properties in the context window. This opens the following dialog:
Graphical Simulation of the I-V Characteristic Curve
As described previously, the manufacturers of photovoltaic panels provide characteristic curves of the current as a function of the voltage (I-V) at different intensities of solar irradiation. Proteus allows you to simulate these curves, also providing a way to obtain the curves at particular light intensities not specified in the datasheet. These curves are obtained using Transfer Function Graphs (available with the 'Advanced Simulation Features' product). Here is an example
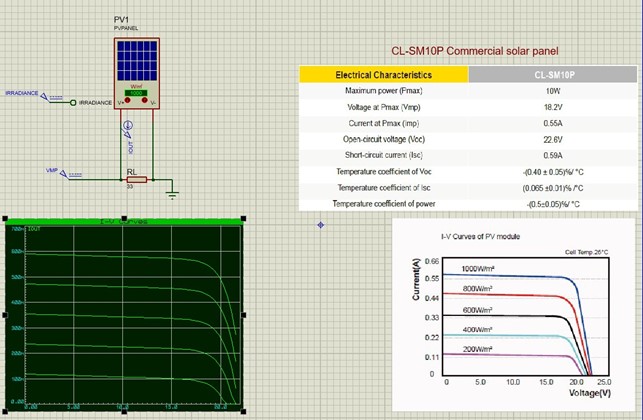
In the simulation, a voltage generator IRRADIANCE is used to generate a voltage value which is equivalent to the solar radiation from 200 W/m^2 to 1000 W/m^2. To enable PVPANEL to accept an external signal instead of the active + and – controls, the Irradiance Source property must be set to External. This will disable the active controls and the part will receive the control value from the (hidden) IRRADIANCE pin.
The Proteus file for I-V Characteristic Curve is linked below and can be evaluated with the demo software.
A demo copy of Proteus is required to open the .pdsprj file.
Proteus Real Time Simulation
The PV panel model can be simulated in real time mode as well. In this mode it is possible to set the solar irradiation value in real time using the two active controls + and –. Note that Active controls are enabled by default, i.e. the Irradiance Source property is set to Active Component.
Multiple panel configurations connected in series, parallel or a combination of two are possible. In this case it is possible to set only one of the panels as master panel and all the others as slave panels.
As an example, let's say we have 12 panels of 18V 100W each that we want to connect in parallel, so that we get 18V @ 1200W. We will connect 12 Panels in parallel as shown below:
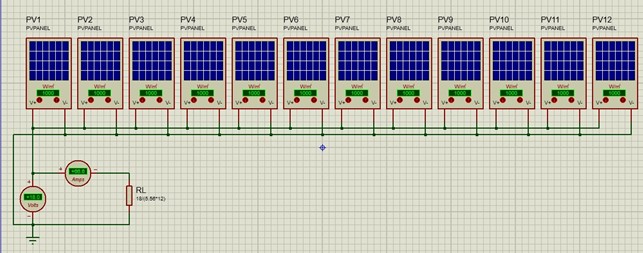
On PV1 we will set the Irradiance Source property to Active Component. On the other panels from PV2 to PV12 we will set the Irradiance Source property to External.
In this way, during the simulation in real time, we will be able to vary the intensity of solar radiation for all the panels from PV1 to PV12 by acting only on the active controls of PV1; those from PV2 to PV12 will be disabled.
The schematic file is available below and can be viewed in the demo copy of Proteus
The Proteus file for PV panel model is linked below and can be evaluated with the demo software.
A demo copy of Proteus is required to open the .pdsprj file.
Conclusion
Photovoltaic cells represent one of the most promising technologies for the production of clean and sustainable energy. These devices convert sunlight directly into electricity, offering an environmentally friendly and low-carbon alternative.
This is also a valid example of how Proteus helps us in the development of physical behavioural models which are the basis of modern energy production devices.
All content Copyright Labcenter Electronics Ltd. 2026. Please acknowledge Labcenter copyright on any translation and provide a link to the source content on www.labcenter.com with any usage.Get our articles in your inbox
Never miss a blog article with our mailchimp emails
Advanced Simulation
Learn more about our built in graphing and advanced simulation features. Harness the mixed-mode simulation engine in Proteus to quickly test your analogue or digital circuitry directly on the schematic.
 Ask An Expert
Have a Question? Ask one of Labcenters' expert technical team directly.