Introduction
In the field of Signal Processing filters are elements which remove (or, more correctly, attenuate) certain frequencies from the waveform.
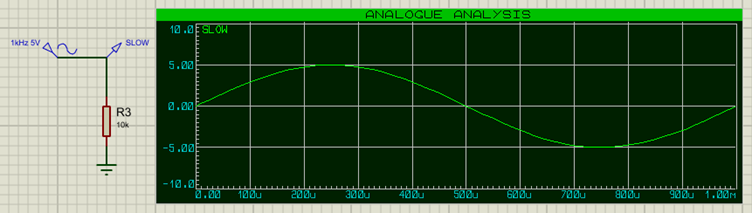
For example, given a slower frequency of 1kHz (5V amplitude)
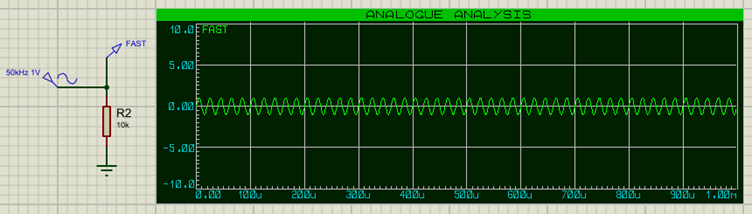
And a faster frequency of 50kHz (1V amplitude):
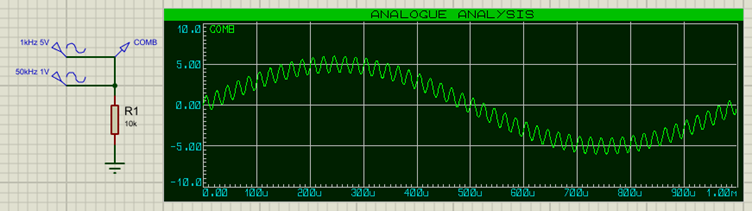
The combined signal would look like this:
Using filters, we can take the combined signal and filter out the component signals again. Why would we want to do that? There are a number of possible reasons, including:
- Shared Medium.
- Noise.
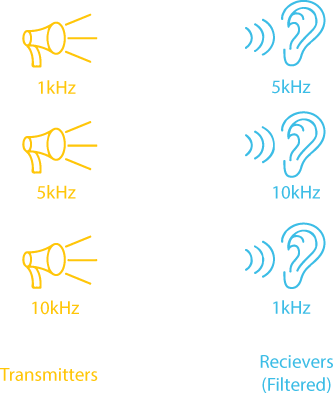
In the case of radio waves (WiFi, mobile phone, car radio, etc), all the signals share the same transmission medium. It’s like there’s only one wire for communication, which everyone has to share. By using different frequencies, many users can share the medium, and just filter out the particular frequencies which they are using.
 Shared Medium.
Noise may be induced into a signal from various sources, such as EMI (Electro-Magnetic-Interference), and this noise can be removed by filtering.
So, how do we go about implementing filters?
Reactive Components
Put simply, reactive components are components which behave differently depending on the frequency which is applied to them. In electronics there are two types of reactive components – capacitors and inductors. Both component types store energy in a magnetic field. Capacitors store energy by building up a charge between two plates
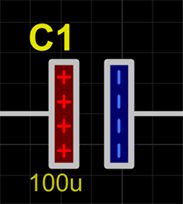
When a voltage is applied to the capacitor then current flows into it until the voltage on the plates matches the voltage applied. Energy is at this stage stored up in the charges accumulated on the two plates, those charges being held in place by the magnetic attraction between them. Once the capacitor has charged up then current stops flowing, until the applied voltage is removed and the current then flows back out of the capacitor again. What we can see is that current flows when the voltage changes, and stops flowing when the voltage is constant; when there is no difference in voltage, then no current flows. To a DC mindset, it is counter-intuitive that current could flow through a capacitor, since there is no electrical connection between the two sides of the capacitor; however an AC current can in fact flow through a capacitor, as energy in transferred via the magnetic field inside the capacitor. From an AC perspective, the capacitor blocks lower frequencies whilst higher frequencies can flow through it.
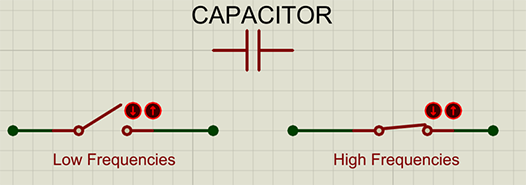
To low frequencies, the capacitor appears like an open-circuit. To high-frequencies, the capacitor appears like a short-circuit. In between, the capacitor appears like a sort of a resistor, opposing current flow to a certain extent, the difference being that the capacitor does not dissipate energy as heat like a resistor does, but rather stores it in its magnetic field.
Inductors store energy in the magnetic field which develops around the inductor windings.
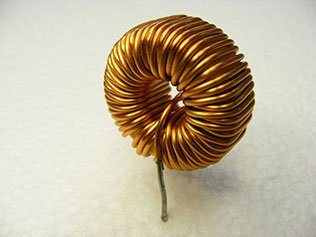
Opposite to capacitors, inductors allow current to flow through when there is no change in voltage, and oppose changes to current and voltage. Where capacitors are more like a spring, inductors are more like a flywheel (for a more in-depth analogy on inductors, please see our Buck Converter and Boost Converters articles). When a voltage is applied to an inductor, then it initially opposes current flow whilst the magnetic field around its windings builds up. Once the magnetic field is established, then DC current flows through the inductor unhindered. If you try to stop the current flowing through the inductor, then the magnetic field produces a voltage to try and keep the current flowing.
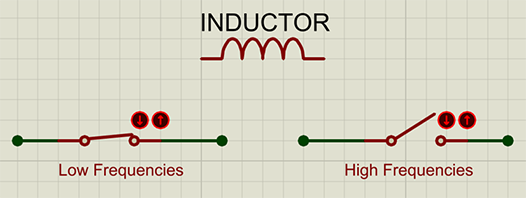
To low frequencies, the inductor appears like a short-circuit. To high-frequencies, the inductor appears like an open-circuit. In between, the inductor also appears like a sort of a resistor, opposing current flow to a certain extent, the difference again being that the inductor does not dissipate energy as heat like a resistor does, but rather stores it in its magnetic field.
With Capacitors and Inductors, we have two reactive elements which behave oppositely when presented with AC frequencies, and we can use these properties to build filters using them.
Decibels
Before we go further, it is important to ensure that we are familiar with the decibel unit of measurement. Decibels are a logarithmic unit, as illustrated by the following graph:
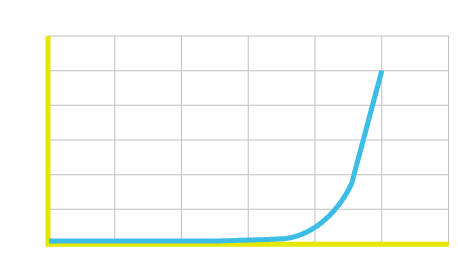
20dB means 10 x the amplitude and 100 x the power, 40dB means 100 x the amplitude and 10,000 x the power, and so on (we won’t get into the relationship between AC amplitude and AC power at this point, but suffice to say that the AC power calculation is more complex than the simple DC one of P = V x I). Using decibles (dB) as a unit of measure allows us to work with a range of values from very small to very large comfortably, and also makes calculations involving chained systems easy as the dB values can simply be added.
Frequency Response Graph
The Frequency Response Graph or Bode Plot shows how a circuit will respond to a range of frequencies, and is thus very useful in filter design and analysis, as we will see in the following sections.
The High Pass Filter
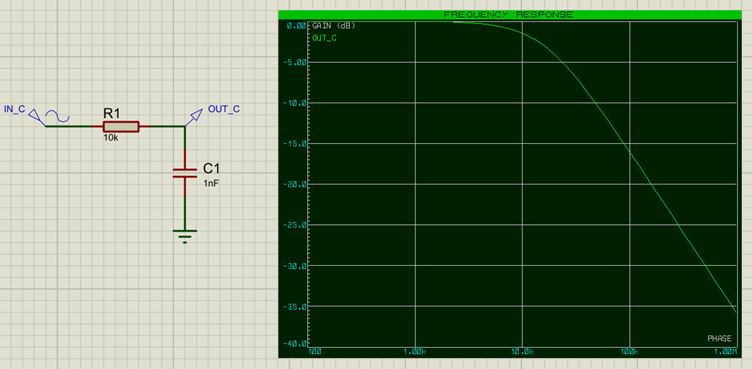
The High Pass filter allows higher frequencies to pass through, whilst attenuating (blocking) lower frequencies. As we have already seen, capacitors allow higher frequencies to pass through them, and so we can use one of these to implement a high-pass filter.
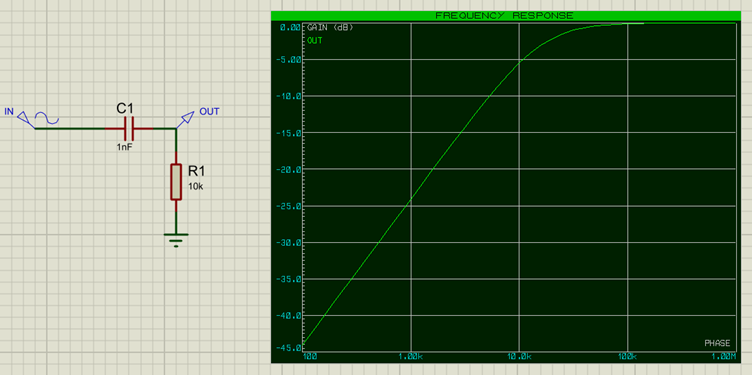
From the Frequency Response Graph, we can see that frequencies above about 16k are passed through (close to 0dB change), whereas frequencies below that get attenuated more and more (a frequency of 100Hz would be attenuated by -44dB). Note that the filter does not have a brick wall effect of blocking lower frequencies, but rather attenuates them more and more the lower the frequency. We can make the dropoff sharper by combining filters, otherwise known as increasing the filter order, and we will get to that later.
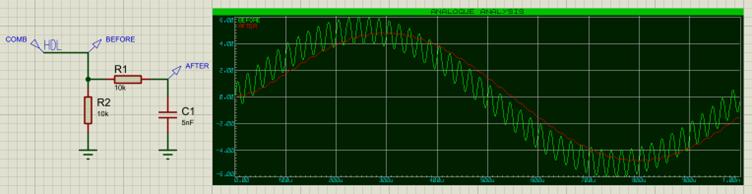
Great! Let's try this out on our earlier example:
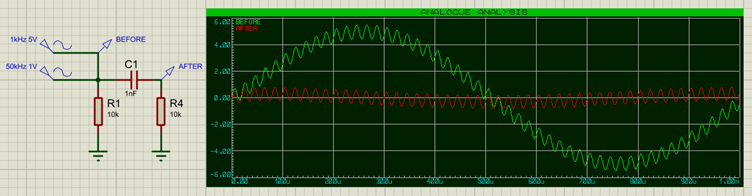
As we can see, the low-frequency 1kHz component has been almost completely removed from the signal after the capacitor (red trace on the graph).We will look at how to calculate the correct component values to use for a given frequency later.
The Low Pass Filter
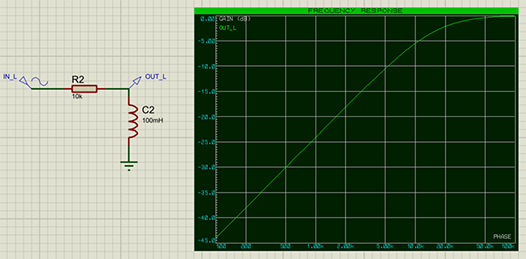
The Low Pass filter does the opposite of the High Pass filter, and allows lower frequencies to pass through, whilst attenuating (blocking) higher frequencies. To change our example to a low-pass filter, we simply exchange the capacitor for an inductor:
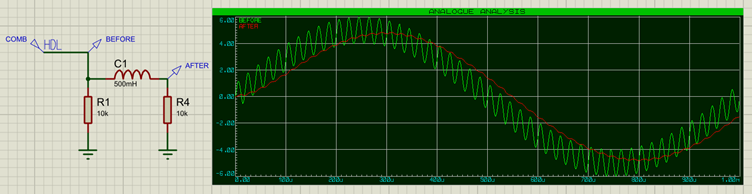
In this case the high-frequency 50kHz component has been almost completely removed from the signal after the inductor (red trace on the graph). The Frequency Response Graph for the inductor looks as follows:
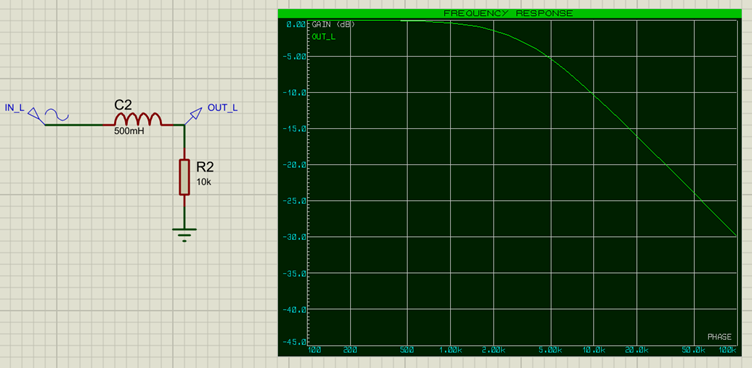
Again, we can see that frequencies below about 3k are passed through (close to 0dB change), whereas frequencies above that get attenuated more and more (a frequency of 100kHz would be attenuated by -30dB). Note again that the filter does not have a brick wall effect of blocking higher frequencies, but rather attenuates them more and more the higher the frequency. Again, we can make the dropoff sharper by combining filters, otherwise known as increasing the filter order, which we will cover later.
We can also build a low-pass filter with a capacitor:
In this case the high-frequency is bypassed through the capacitor to ground, removing it from the signal.The Frequency Response graph for this configuration looks as follows:
Alternate High Pass Filter
Similarly, we can construct a high-pass filter with an inductor:

Here it is the low-frequency component that is bypassed through the inductor to ground, removing it from the signal.The Frequency Response graph for this configuration looks as follows:
The Cutoff Frequency
The Cutoff Frequency is defined as the -3dB point on the Frequency Response graph, which is the point at which the signal has been attenuated to 50% of its original power (approximately 70.8% of its original voltage). This is also the point where the lines from the attenuation slope and pass slope (level) meet on the graph.
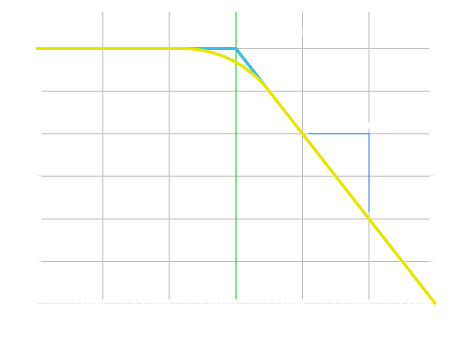
Again, it is obvious that this is not a brick wall cutoff point, however some point has to be chosen to describe the filter characteristic and cutoff frequency is the term used for this point.
The cutoff frequency is given by the formula:
Cutoff Frequency = 1 / 2πRC
for a capacitive filter. For an inductive filter it is:
Cutoff Frequency = R / 2πL
Let's work this through with the component values on our frequency response graphs above. In the capacitive filter case we have a 10k resistor with a 1nF capacitor which gives:
Cutoff Frequency = 1/2π(10x10³)(1x10-9) = 15.9kHz
In the inductive filter case we have a 10k resistor with a 100mH inductor, giving:
Cutoff Frequency = (10x10³)/2π(0.1) = 15.9kHz
In both cases this matches what we've seen on the frequency response graphs.
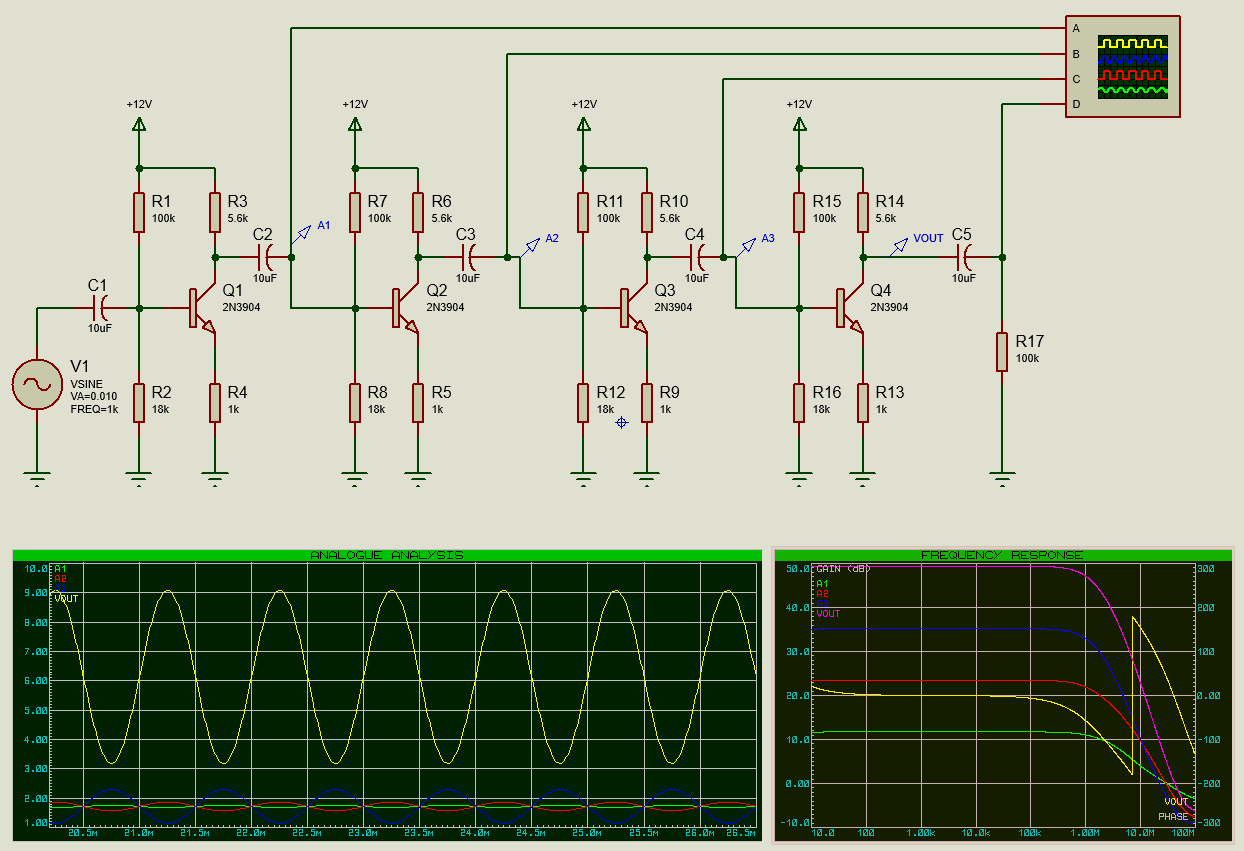
Higher Order Filters
All of the filters which we’ve looked at so far have a single reactive element. The Frequency Response graphs have slopes of approximately 20dB/logarithmic-decade in the stop region. By using more reactive elements and/or chaining filters, we can increase the slope by approximately 20dB per reactive element. This is called increasing the order of the filter. For example, the below is a 2nd-order filter (2 reactive elements) with a slope of approximately 40db/decade.
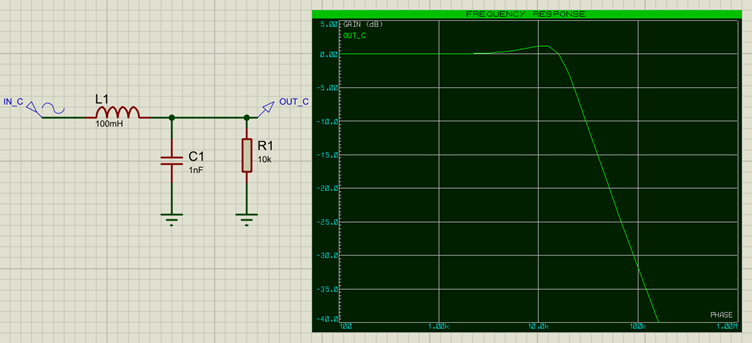
Note however that there are also drawbacks to increasing the filter order too much, such as summed attenuation of the signal even in the pass-band and delay of signal propogation, as well as added cost and circuit complexity.
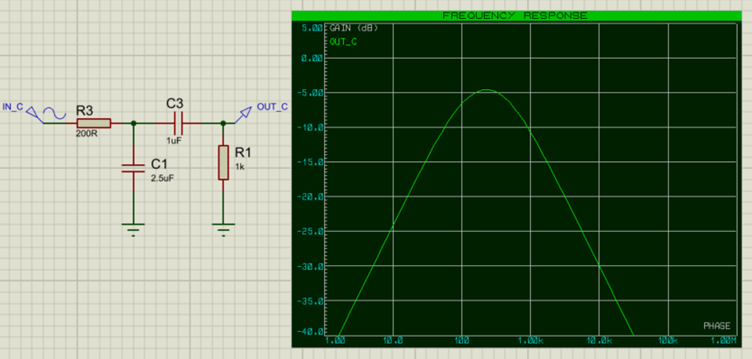
Band Pass and Band Stop Filters
Finally, we can create a band pass or band stop filter by combining a high-pass filter and a low-pass filter with appropriately-valued cutoff frequencies.
Conclusion
Filters are fairly simple once understood, and are an important tool for a signal processing engineer to be familiar with. In this article we have looked at passive analogue filters; there are also active analogue filters, which we will cover in another article.
All of the test cases and graphs in this article were created with the Proteus Design Suite. The Advanced Simulation Features module provides over a dozen different graph types and easy access to signal generators and voltage/current probes.
All content Copyright Labcenter Electronics Ltd. 2026. Please acknowledge Labcenter copyright on any translation and provide a link to the source content on www.labcenter.com with any usage.Get our articles in your inbox
Never miss a blog article with our mailchimp emails
Advanced Simulation
Learn more about our built in graphing and advanced simulation features. Harness the mixed-mode simulation engine in Proteus to quickly test your analog or digital circuitry directly on the schematic.
 Ask An Expert
Have a Question? Ask one of Labcenters' expert technical team directly.